Importing results into Perseus
Reports generated by FragPipe can be used with a variety of tools for exploratory analysis, differential quantification, and visualization. For Windows users, Perseus can be used to perform such tasks on FragPipe tables from label-free or isobaric labeling-based quantification. This page has instructions for loading a ‘combined_protein.tsv’ table into Perseus.
Open Perseus
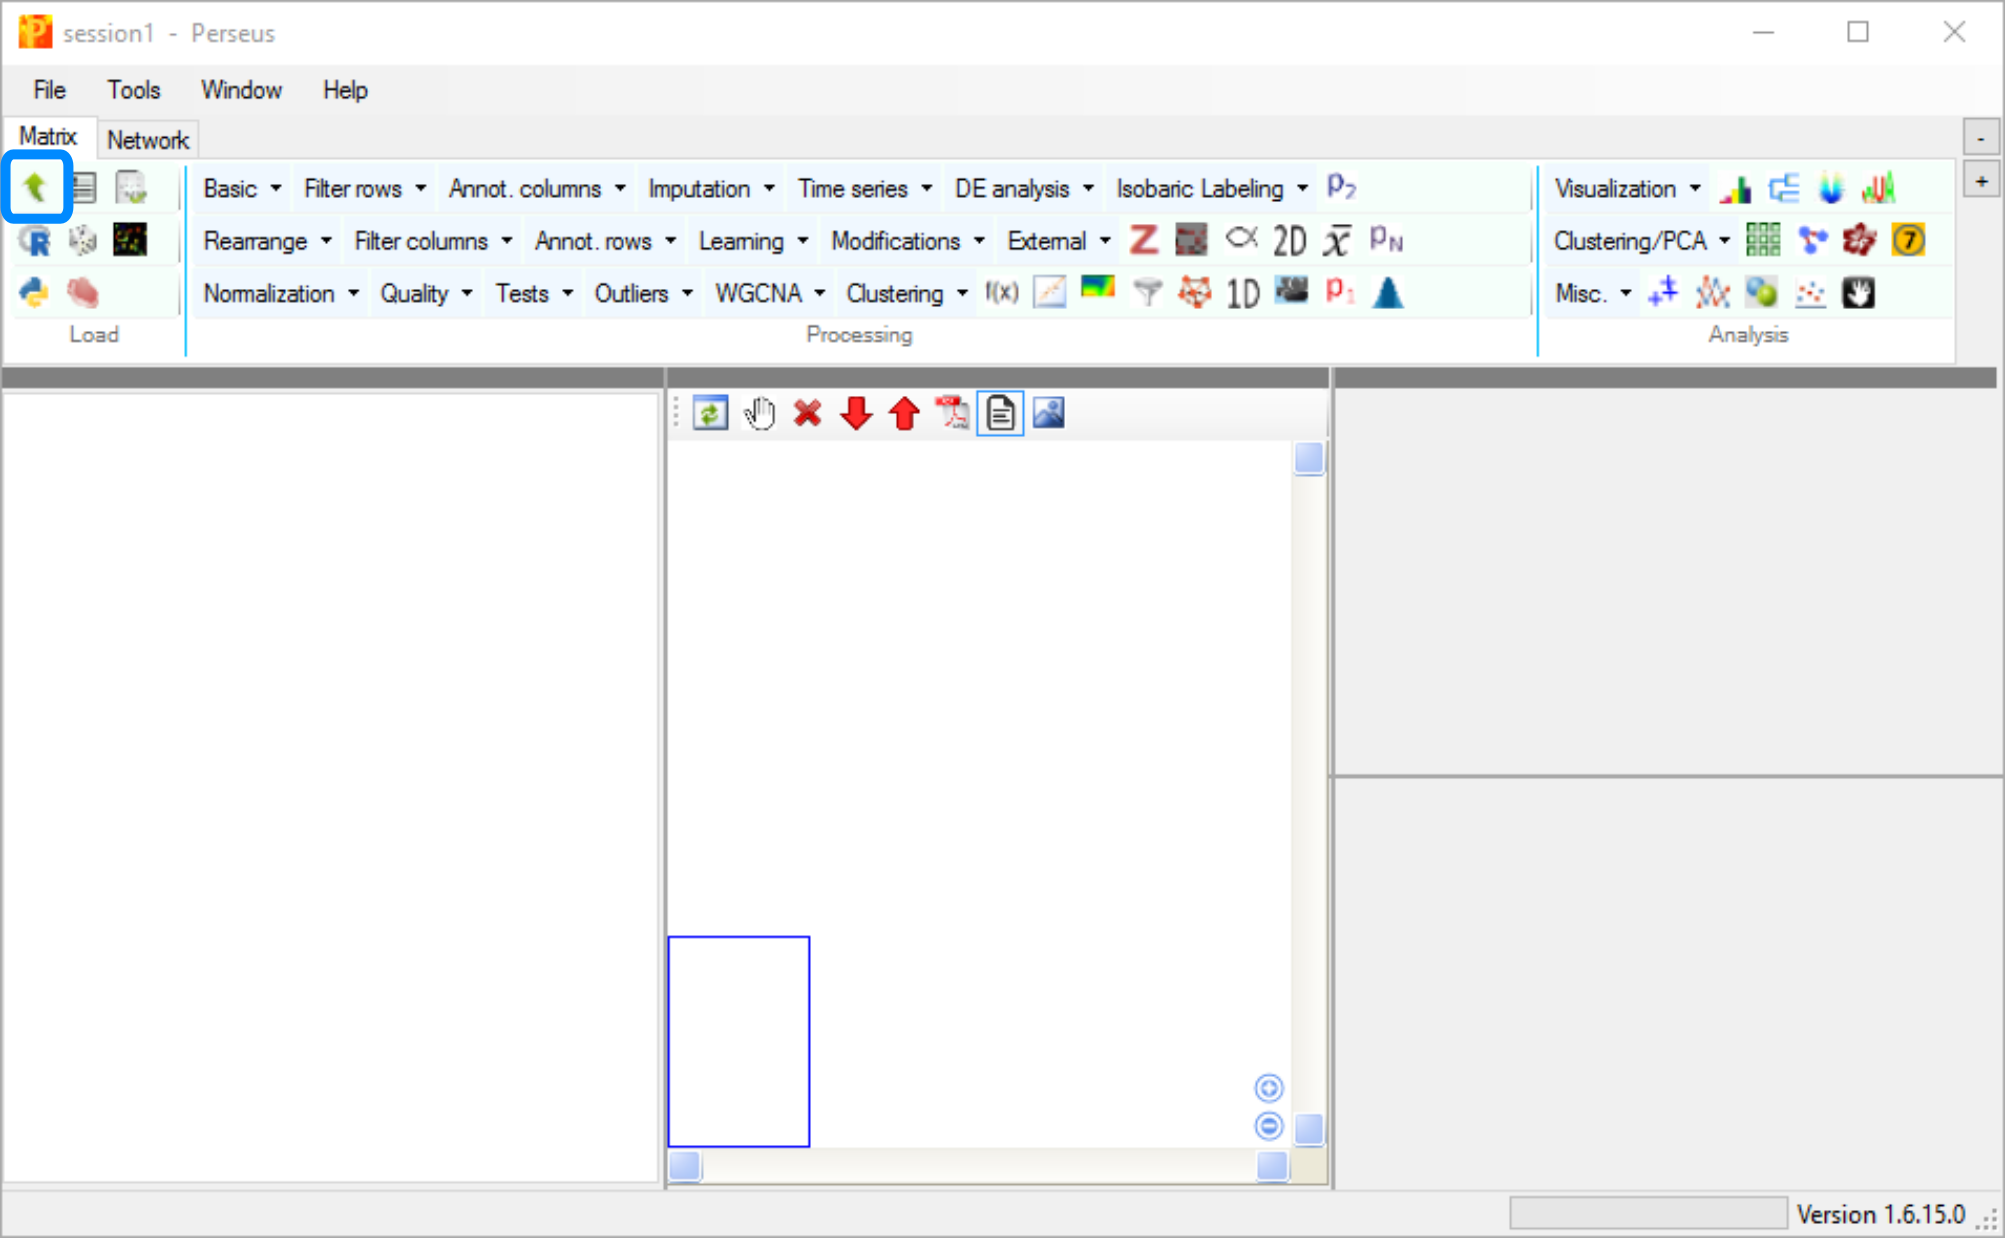
Download and unzip the file from the download page, then launch by double clicking ‘Perseus.exe’. When the program launches, open the matrix upload dialogue by clicking the green arrow icon on the Matrix tab.

Load FragPipe results
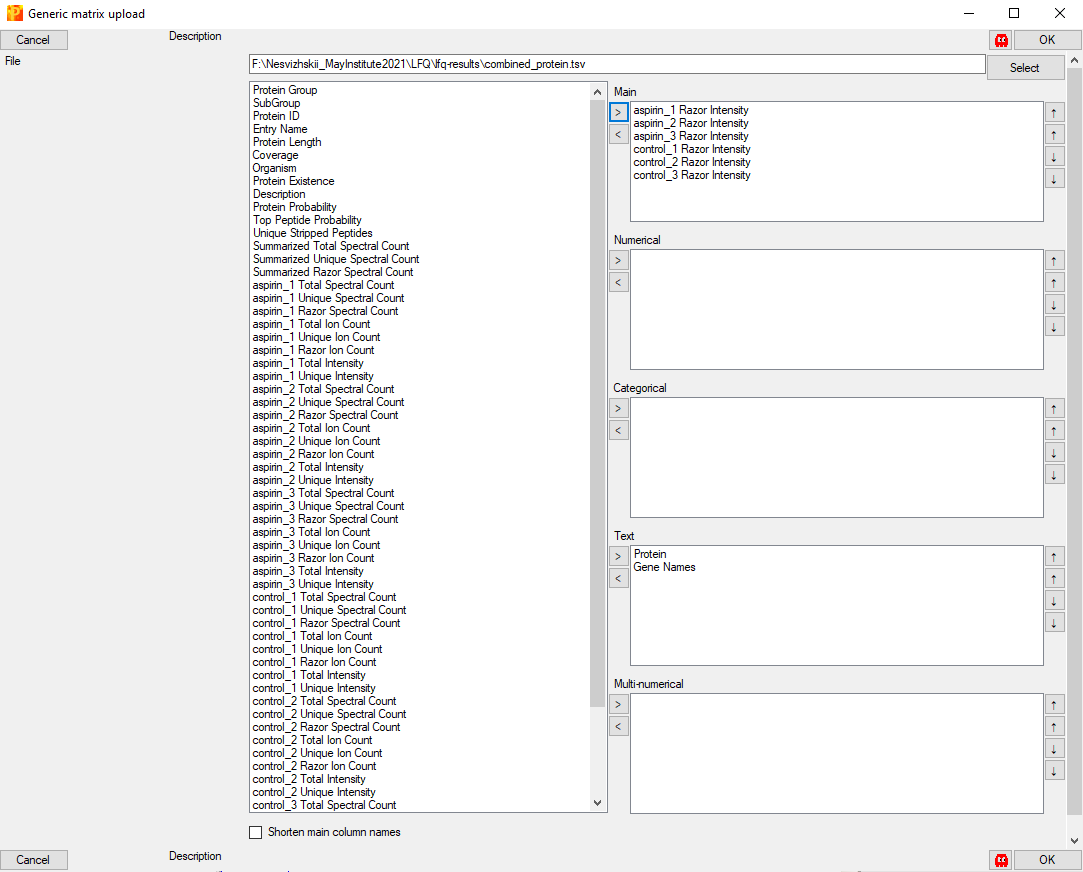
Use the ‘Select’ button to find the ‘combined_protein.tsv’ file from FragPipe. Column names will be listed in the left panel. Select the columns containing the intensities you want to explore or compare and use the ‘>’ to move them over to the ‘Main’ section. (For this example, there are a total of six samples from two different experimental conditions, so we load the six ‘[sample] Razor Intensity’ columns.)
Relevant labels (e.g. protein ID and gene name) should be moved to the ‘Text’ section. When the columns of interest have been categorized, click ‘OK’.

Explore the data
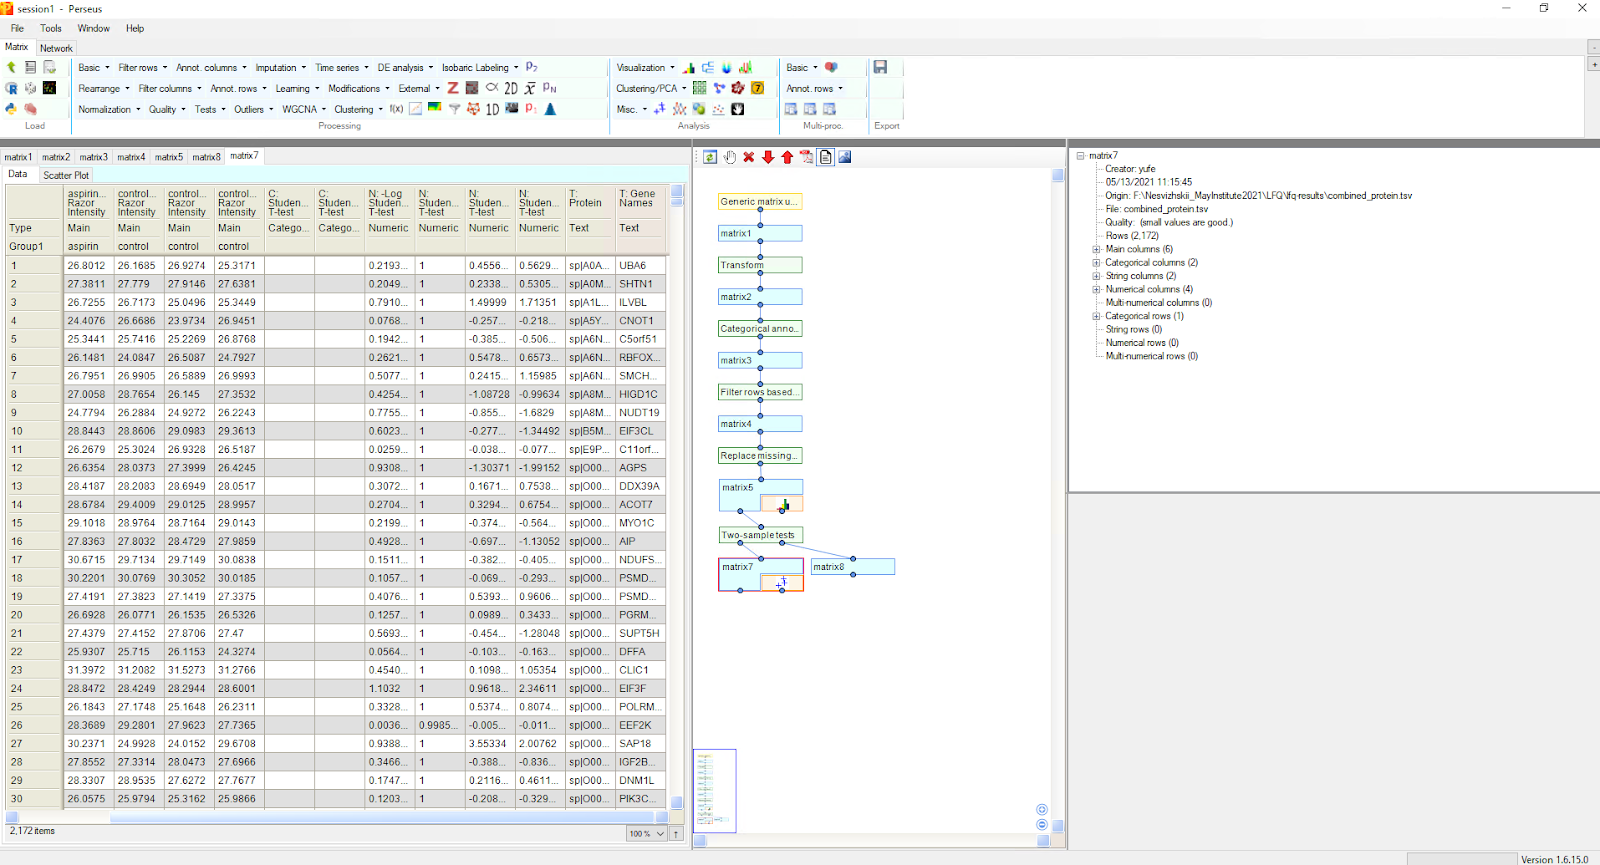
Once the matrix is loaded, intensity transformation, row annotation, filtering, hypothesis testing, plotting, and other analyses can be performed. See the Perseus site for more details.
