Analyzing SILAC samples (or other MS1-labeled samples) with FragPipe
FragPipe can be used to identify and quantify MS1-labeled samples with MSFragger and IonQuant. Below are step-by-step instructions to perform SILAC (Stable Isotope Labeling by Amino acids in Cell culture) or other labeling-based MS1 quantification (such as dimethyl). In this example, we will use the built-in workflow for Heavy/Medium/Light SILAC.
1) Load the SILAC3 workflow
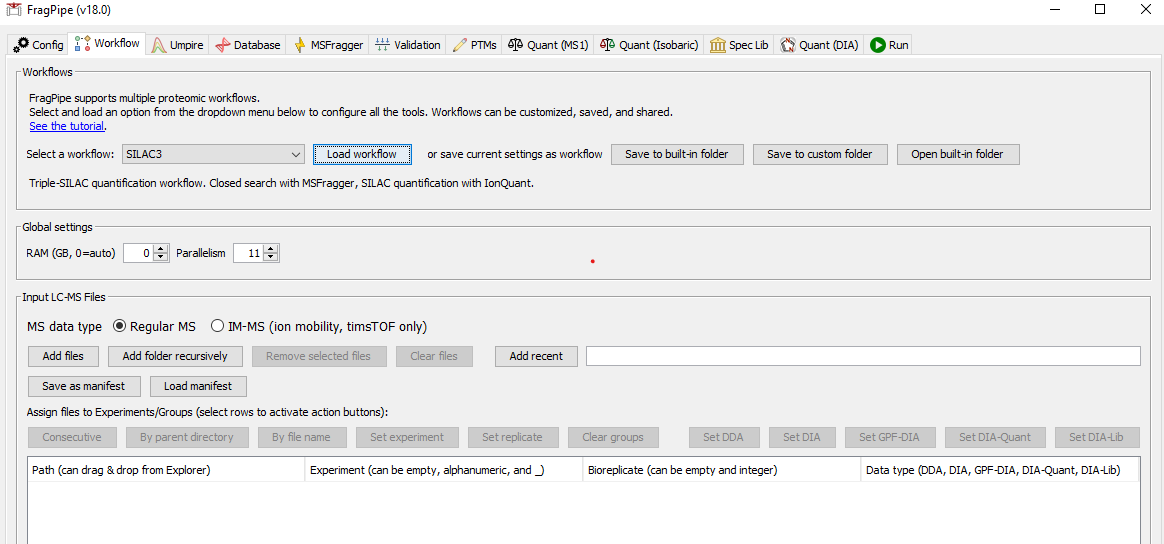
On the ‘Workflow’ tab, select ‘SILAC3’ from the dropdown menu and click ‘Load’. Add spectral files by dragging and dropping or use the file browser.

2) Specify or download a FASTA file
On the ‘Database’ tab, use ‘Browse’ to load an existing sequence database or ‘Download’ to fetch one from UniProt.

3) Select the appropriate variable modifications
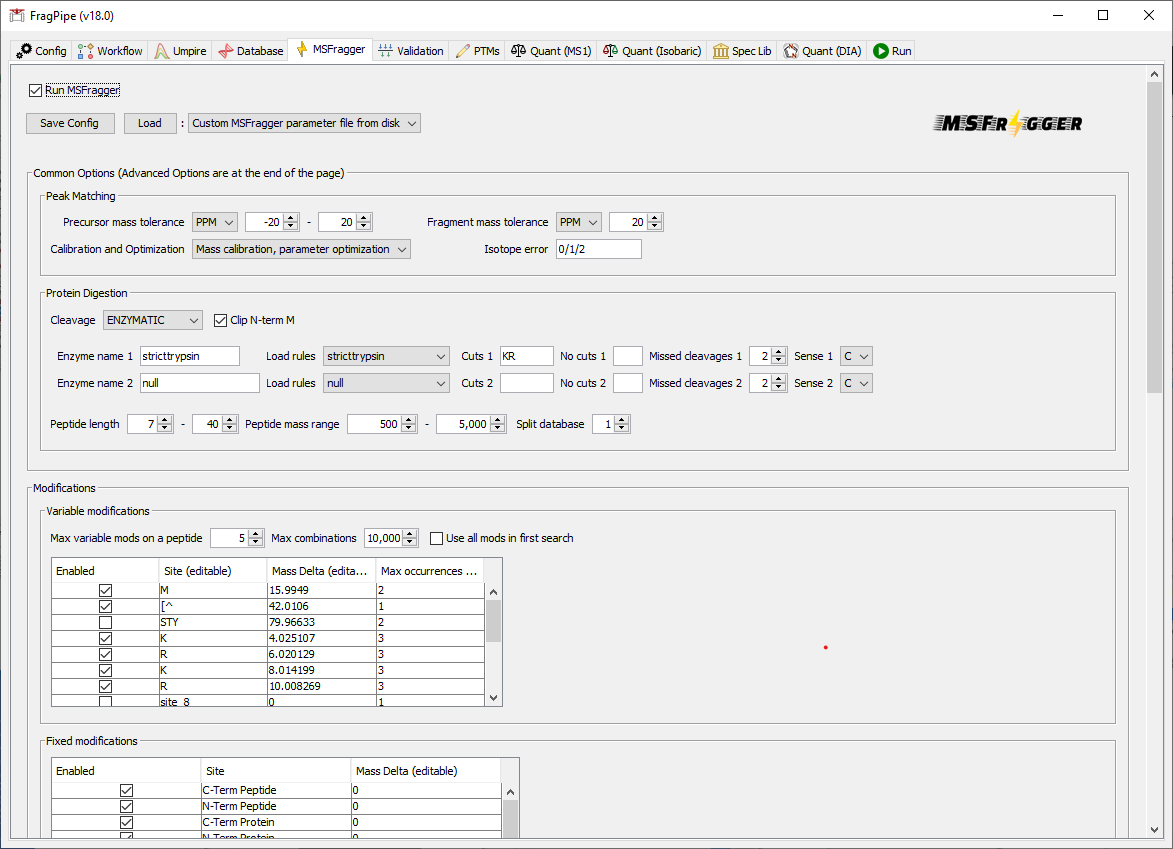
On the ‘MSFragger’ tab, inspect the search parameters. The SILAC3 workflow specifies the medium and heavy SILAC labels (K4R6/K8R10) in the ‘Variable modifications’ box.

To use a different kind of labeling, fill in the corresponding sites and modification masses. For example, to specify light and heavy dimethyl labels, variable modifications should be specified as shown below:

4) Use IonQuant for MS1 quantification
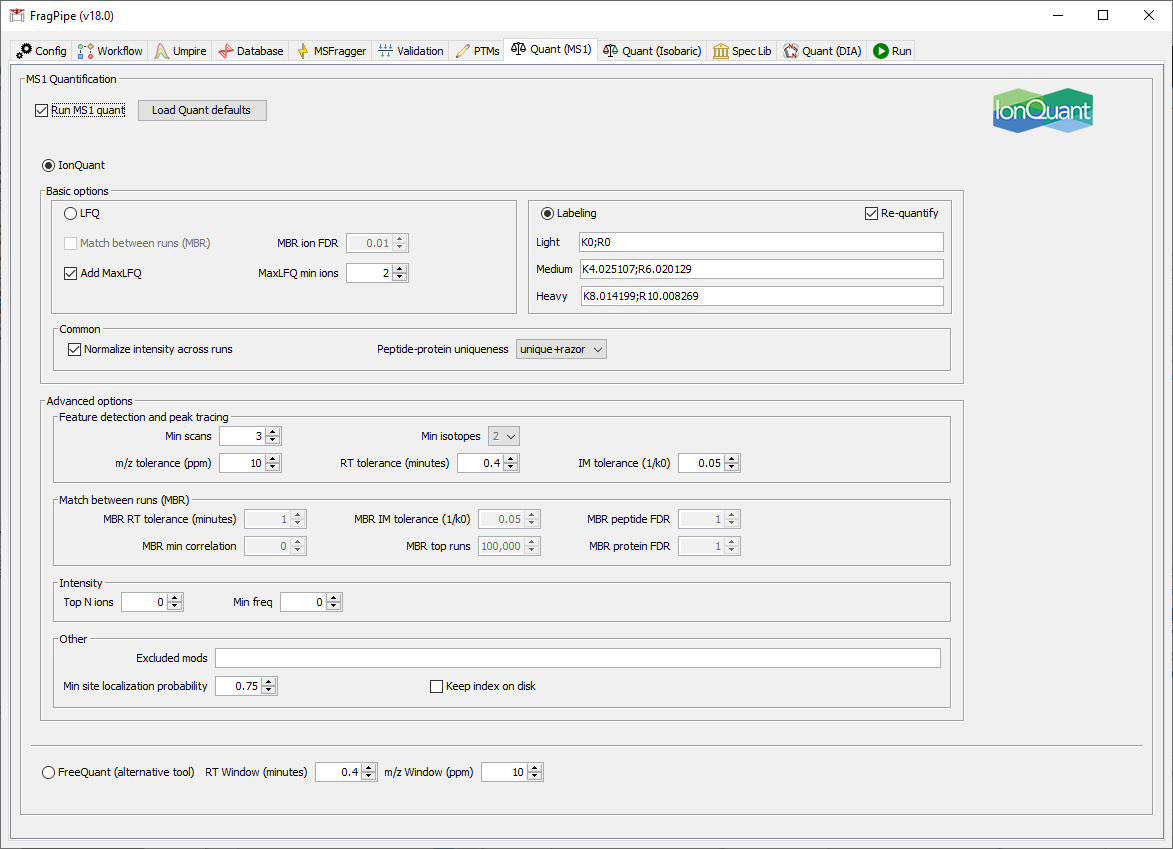
On the ‘Quant (MS1)’ tab, IonQuant has been set to run with SILAC light, medium, and heavy labels that match those specified in the MSFragger search.

If you are using light and heavy dimethyl labeling, adjust the variable modifications in the MSFragger tab and change the labeling settings to:

5) Specify output location and run
On the ‘Run’ tab, choose an output file location, then click ‘RUN’.

Output
For each experiment, the results folder will contain multiple files, including psm.tsv, ion.tsv, peptide.tsv, and protein.tsv reports. Entries in these files have been filtered with the user-defined FDR threshold, with the SILAC (or similar) modifications shown as variable modifications. For SILAC (and similar) samples, these reports do not provide ratio abundances (e.g. heavy/light) at each (ion/peptide/protein) level. Instead, as for label-free data, each PSM/ion/peptide is considered independently, and the protein file shows combined protein intensity based on all peptides, regardless of the label/sample status.
Thus, IonQuant generates additional files exclusively for MS1-labeled data: ion_label_quant.tsv, peptide_label_quant.tsv, and protein_label_quant.tsv. Entries in these two files correspond to those in the ion.tsv, peptide.tsv, and protein.tsv files, respectively, but are presented in a more useful ratio (e.g. medium/light, heavy/light, etc.) format.