Streamlined activity-based protein profiling of reactive cysteines (SLC-ABPP)
This tutorial demonstrates how to analyze samples prepared with a desthiobiotin iodoacetamide (DBIA) probe and TMT isobaric labels for high-throughput profiling of reactive cysteines, type of activity-based protein profiling (ABPP). The method and dataset is described in the paper:
We will use just two TMT-16 plexes from the paper, where PaTu-8988T cells were treated with various chloroacetamide electrophiles of interest. Cysteines that do not get covalently labeled with the chloroacetamide compounds are then alkylated with a desthiobiotin iodoacetamide (DBIA) probe (+239 Da), TMT-labeled, and enriched with avidin. Site-level abundance changes between samples treated with different electrophiles can thus reveal distinct reactivity profiles.
The unfractionated data were acquired with an Orbitrap Fusion Lumos using a real-time search (RTS) acquisition method.
Tutorial contents
- Download data
- Set workflow and load files
- Fetch database
- MSFragger search settings
- Validation settings
- Quantification settings
- Run the analysis
- Results
Download data
Download the two TMT-16 plexes (JM4989_8988T_Cys_TMT_1.raw and JM5020_8988T_Cys_TMT_20.raw) from PRIDE and convert them to mzML format. Each plex (one mzML spectral file) is in a separate folder, each with an annotation file that denotes which sample is in which TMT channel. The first channel contains a DMSO-treated control sample in each plex.
annotations for plex JM4989:
126 DMSO-1
127N CL1-1
127C CL2-1
128N CL3-1
128C CL4-1
129N CL5-1
129C CL6-1
130N CL7-1
130C CL8-1
131N CL9-1
131C CL10-1
132N CL11-1
132C CL12-1
133N CL13-1
133C CL14-1
134N CL15-1
annotations for plex JM5020:
126 DMSO-2
127N CL1-2
127C CL2-2
128N CL3-2
128C CL4-2
129N CL5-2
129C CL6-2
130N CL7-2
130C CL8-2
131N CL9-2
131C CL10-2
132N CL11-2
132C CL12-2
133N CL13-2
133C CL14-2
134N CL15-2
Set workflow and load files
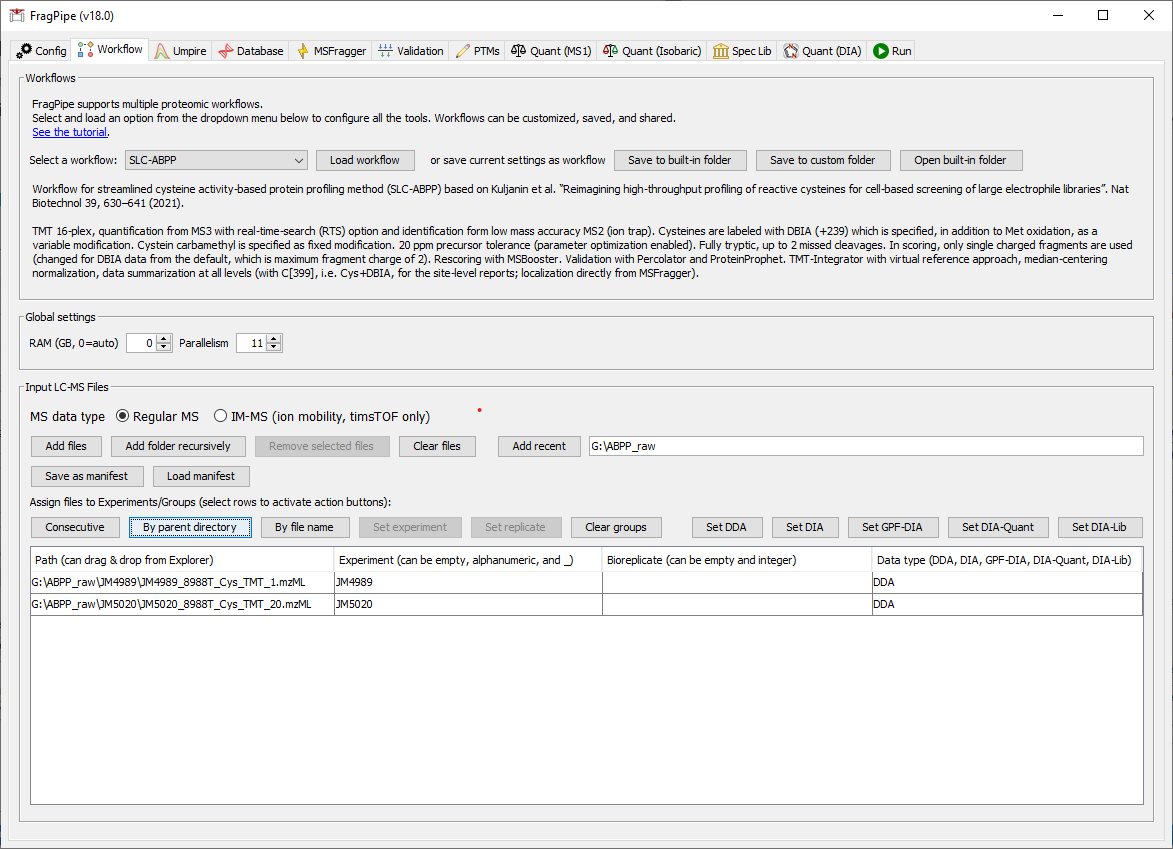
Launch FragPipe, and on the ‘Workflow’ tab, select the ‘SLC-ABPP’ workflow from the dropdown menu and click ‘Load’. In the ‘Input LC-MS Files’ section, click ‘Add folder recursively’ to find and ‘Select’ the ABPP_raw folder.
You can then use the ‘By parent directory’ button to assign the appropriate label to each plex.
Fetch database
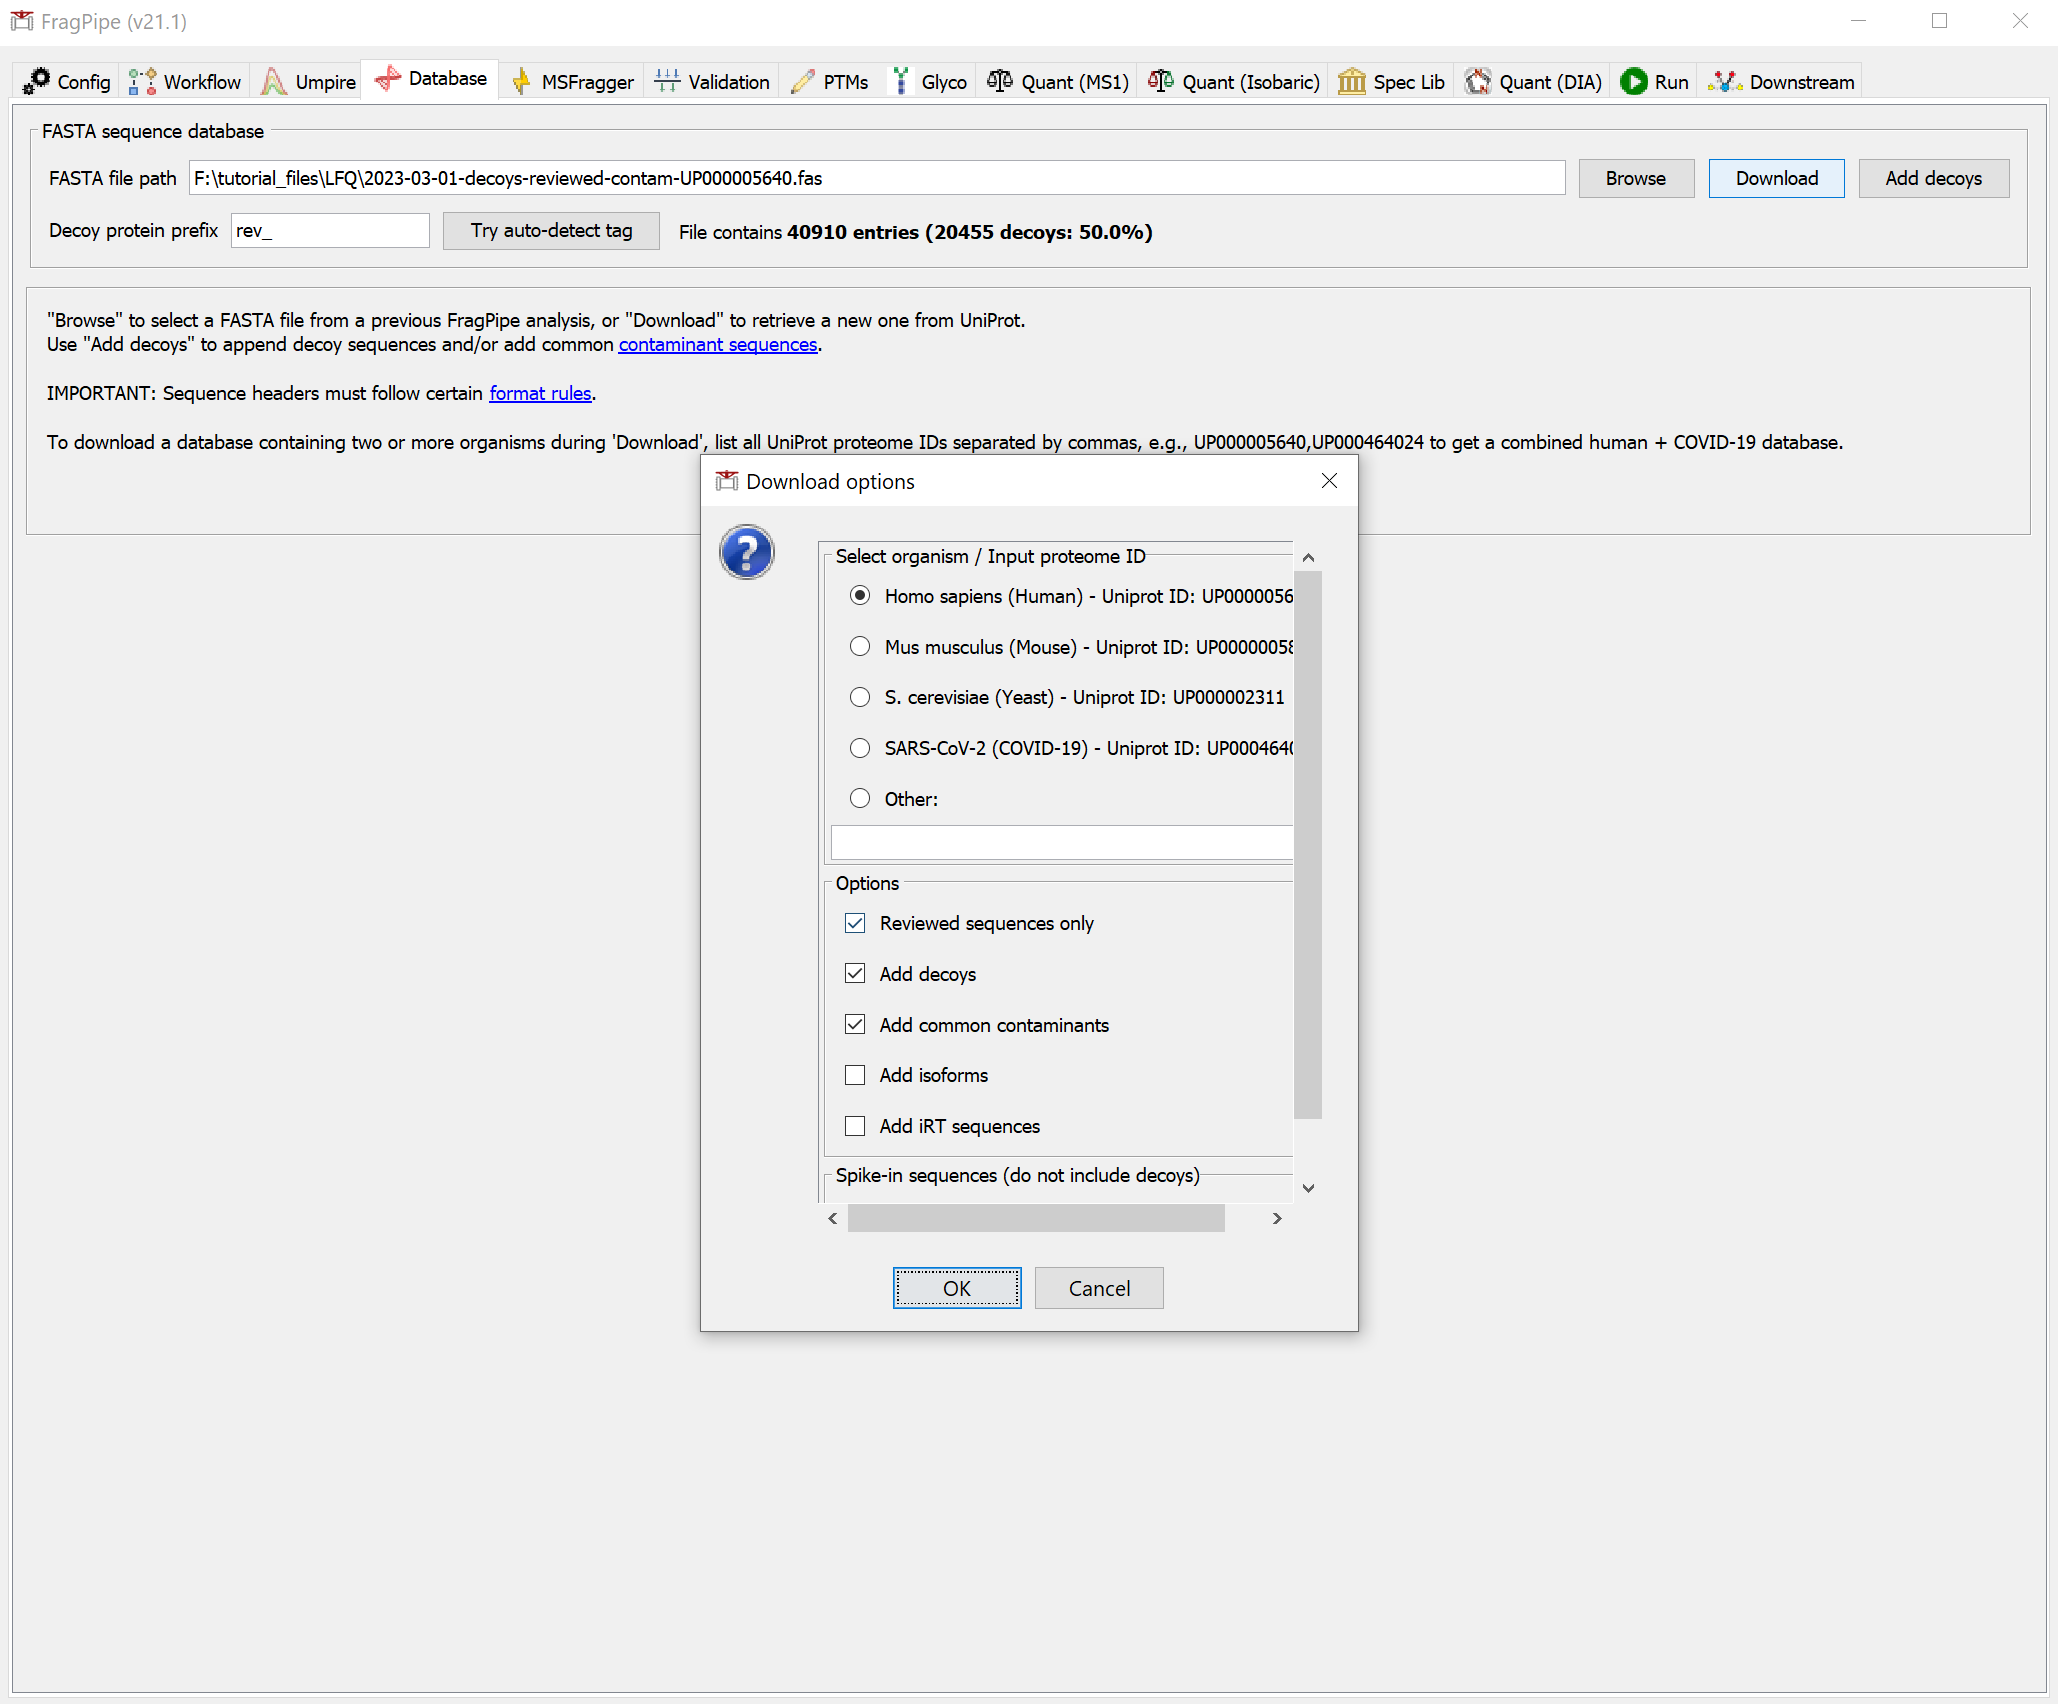
On the ‘Database’ tab, click ‘Download’ and then ‘OK’ to use the default settings (reviewed human sequences plus decoys and common contaminants), then specify a download location, which you can set to the ‘ABPP_raw’ folder.
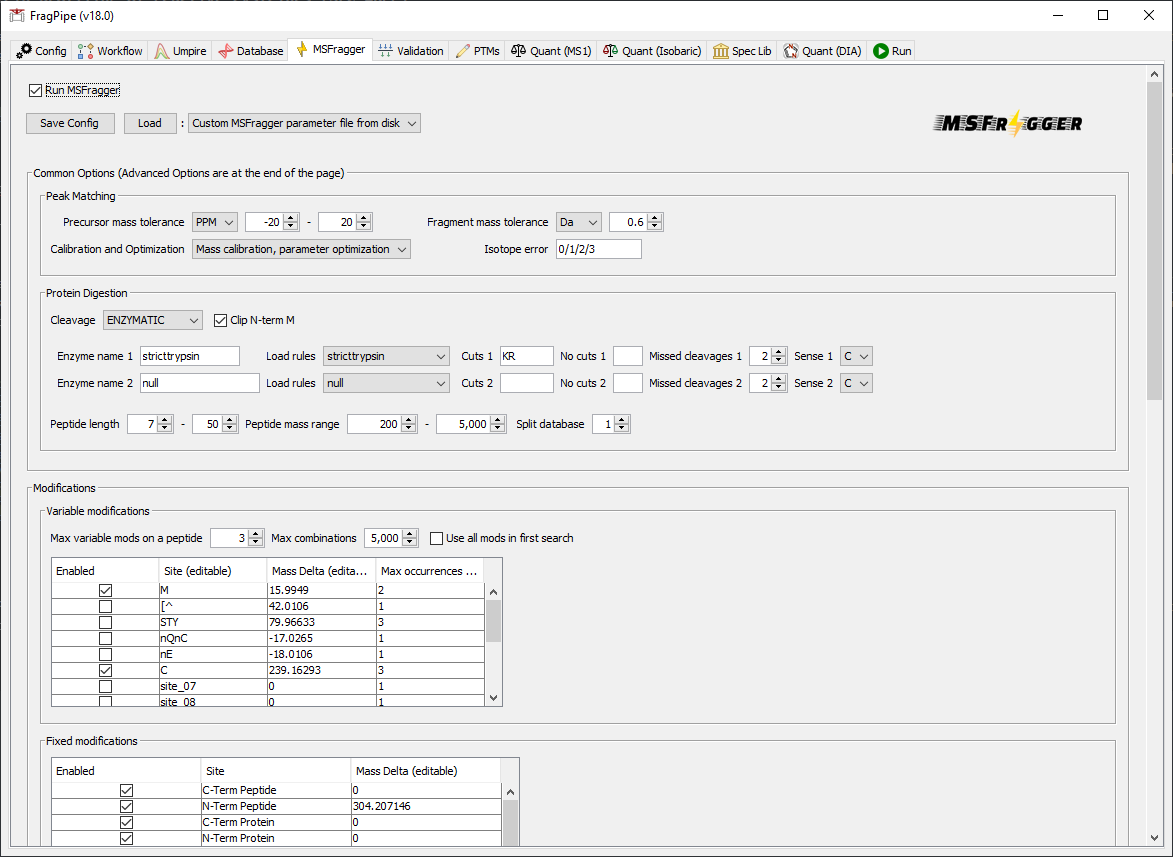
MSFragger search settings
The ‘SLC-ABPP’ workflow has already set the MSFragger search settings.
Validation settings
For this tutorial, the settings on the ‘Validation’ tab do not need to be modified. (Percolator is now used by default for PSM validation in TMT workflows, but you can choose to use PeptideProphet instead.)
Quantification settings
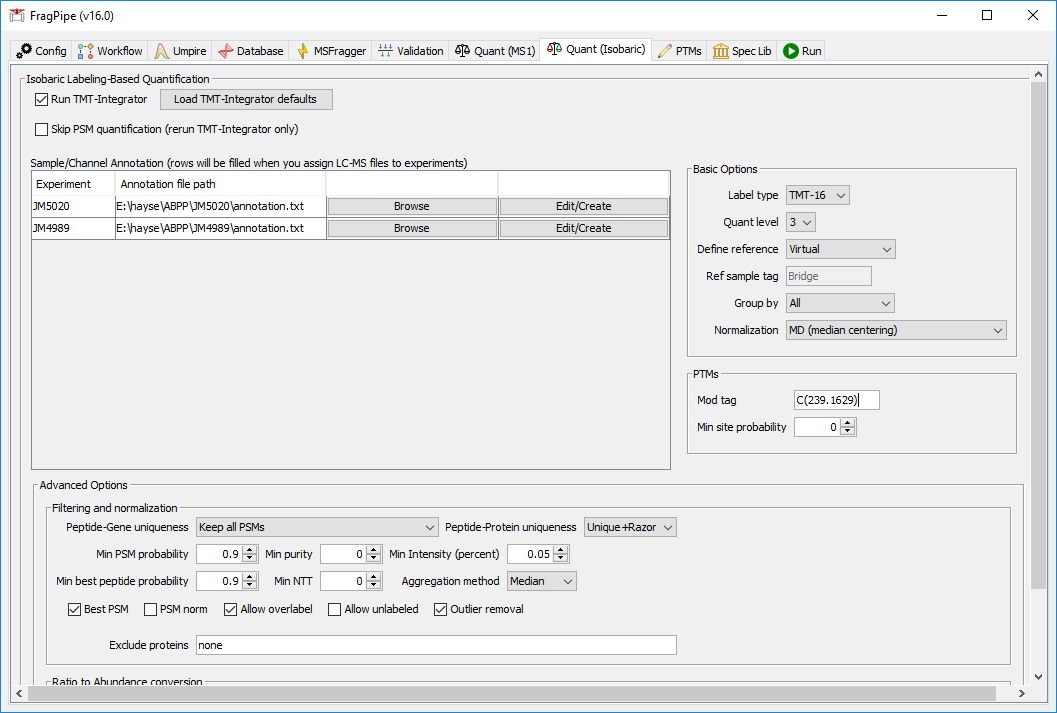
In the ‘Quant (Isobaric)’ tab, the TMT-16 channel annotations should be automatically loaded for each plex. To view or edit the annotation files, use the ‘Edit/Create’ button.
In the ‘Basic Options’ section, set ‘Group by’ to ‘All’ to generate reports at all levels. In the PTMs section, add the ‘Mod tag’ “C(239.1629)” and set the ‘Min site probability’ to 0 (to use modification localization determined by the search).
In the ‘Filtering and normalization’ section, set ‘Min purity’ to 0, since ion purity filtering is not needed for RTS-MS3 data.
Run the analysis
On the ‘Run’ tab, choose an output directory, then press ‘RUN’.
Results
When the analysis is finished, identification reports with raw quantification values (psm.tsv, ion.tsv, peptide.tsv, protein.tsv) will be in a separate results folder for each plex (e.g. ‘JM4989).
TMT-Integrator reports will be in a separate folder, ‘tmt-reports’. These reports contain normalized log2-transformed values, with separate files for both abundances (intensities) and ratios at each level (gene, protein, peptide, etc.). See the TMT/iTRAQ section on this page for more details.
The single-site reports can be used to identify patterns in cysteine reactivity, where Cys+239 sites with lower abundance were more reactive with the electrophile initially added to the cells.