Fast photochemical oxidation of proteins (FPOP) Data Analysis with FragPipe
Update: Oct 16th, 2023
FPOP Overview
Structural information of proteins can be obtained by labelling solvent accessible regions under different environmental states.
In FPOP, OH radicals are used to irreversibly oxidize solvent exposed residues of proteins undergoing structural changes due to perturbations such as ligand-binding or mutations.
We have implemented an hybrid workflow in FragPipe to search the most common FPOP modifications as variable modifications, and the rest as mass offsets.
See publication for more details.
This tutorial will cover running an example FPOP analysis on a small dataset and explain the key search parameters and how to interpret the outputs.
Tutorial Contents:
- Example FPOP Dataset
- Input data conversion
- Setting up FragPipe
- Running Worklfow
- Understanding the Results
- Downstream Analysis
- Expected Results
1. FPOP Dataset
The dataset used for this tutorial is available under in ProteomeXchange with identifier PXD019290. In this study they performed FPOP inside live C. Elegans nematodes. In order to increase efficiency of In Vivo- FPOP labelling, chemical compounds capable of making the nematodes more permeable to OH radicals were used. Oxidation is already present at background levels in cells, therefore is a great importance to use several controls to ensure the increase in oxidation. It will be typical in FPOP experiments to see several replicates and types of controls to ensure that the increase in oxidation is due to a structural change of proteins and not oxidation from other sources. For training purposes, the tutorial dataset used is a fraction of the original dataset. The samples to be used correspond to experiments with/without the chemical enhancer 1pAZ and the respective with (FPOP) or without (no FPOP) laser controls.
Ways to obtain the tutorial dataset
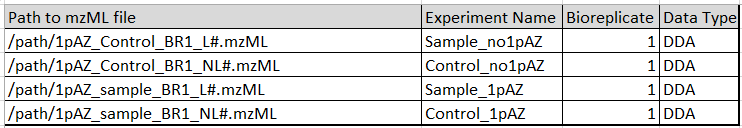
Dataset can be accessed by ProteomeXchange or going directly to PRIDE. Go to project FTP Only the following files are needed ( see path column below), where # stands for all the replicates (1 – 3). The other columns will be used in section III.:
2. Input Data Conversion
Convert .RAW to mzML file using MSConvert with the recommended parameters.
3. Setting up FragPipe
Follow FragPipe Tutorial for FragPipe configuration, adding data, and selecting a workflow here. To see how to divide the files into experiments see the manuscript file example in section Ways to obtain the tutorial dataset above. Next, select FPOP Workflow among the list of built-in workflows.
4. Running a FragPipe Workflow
For general instructions in how to run a FragPipe workflow and saving results, see here.
Key parameters
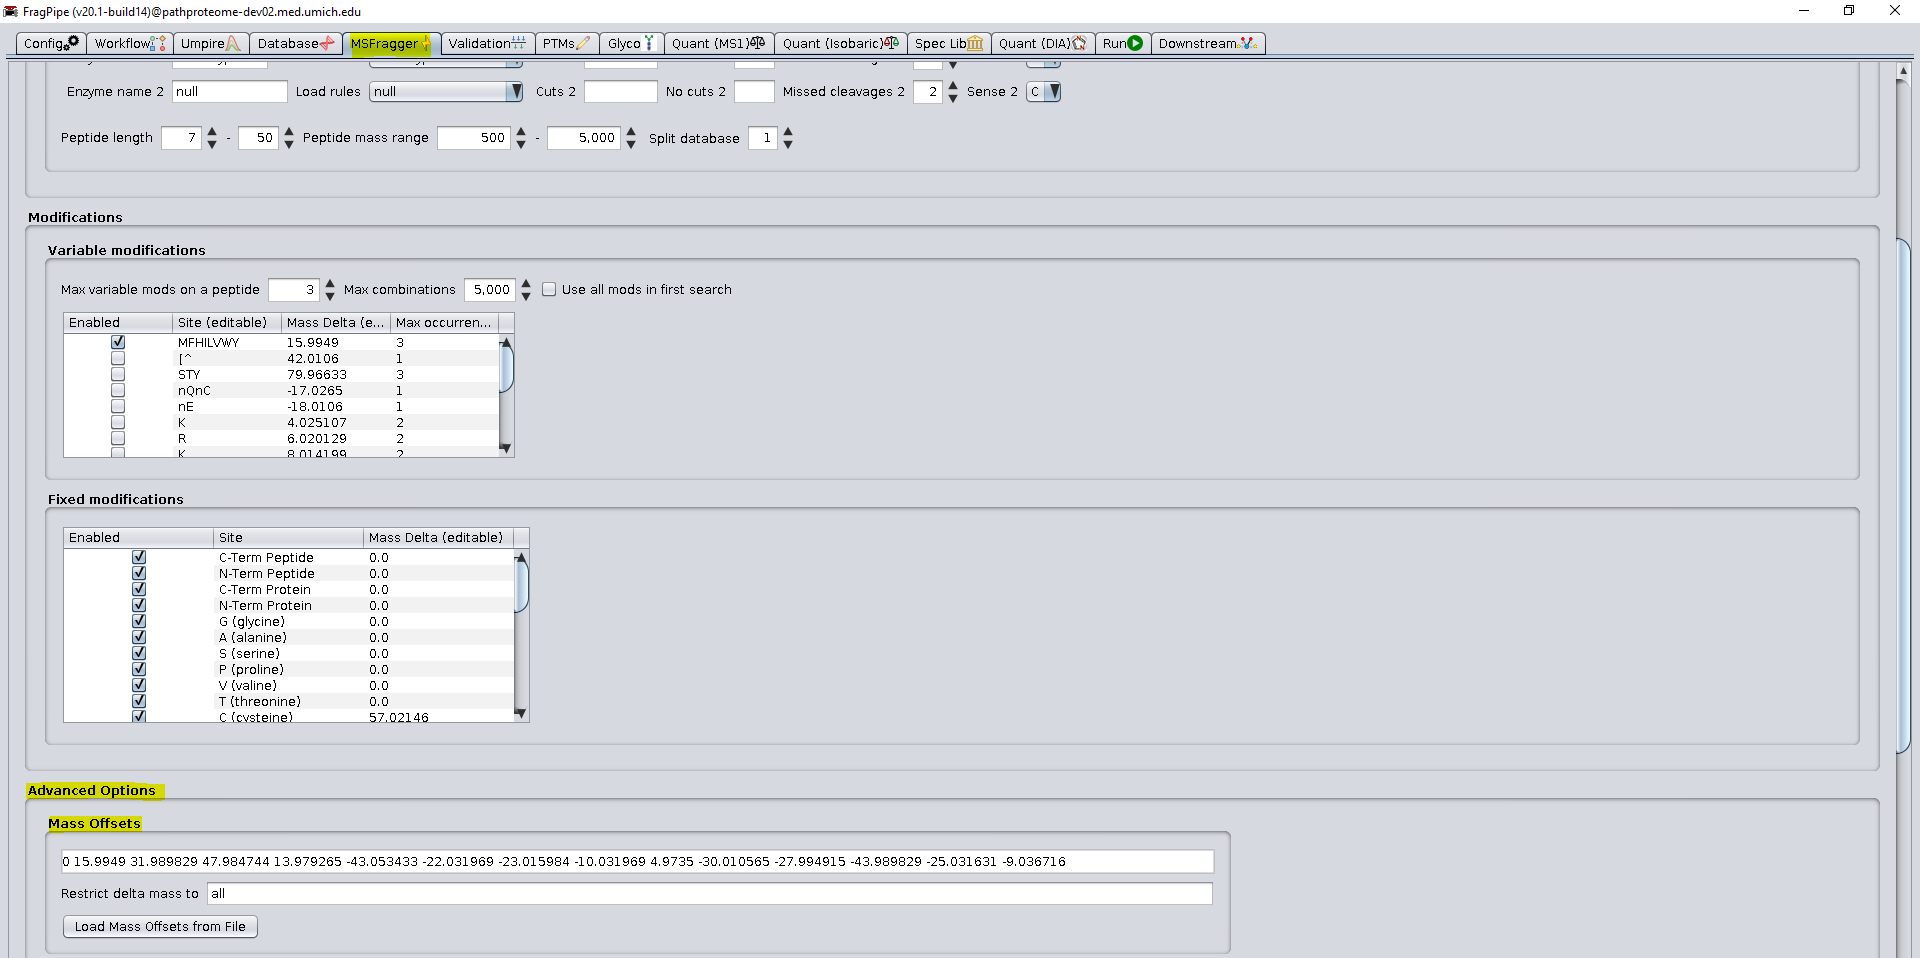
While the current FPOP workflow has been optimized for the current test dataset, the user is encouraged to select appropriate parameters for their data such as enzyme (default is stricttrypsin), as well as if new oxidation modifications are expected. In the figure below mass offset are separated by spaces, but they can also be separated by “/”.
Another point at which the workflow can be tailored for the user’s dataset is the assigned modifications in the Filter command. Due to the large difference in unmodified vs modified peptides (see results below), global FDR filtering will set a threshold that will not be appropriate for both groups. See publication for more details on Group-based FDR. The group FDR command divides PSMs into 3 groups for filtering: unmodified peptides, peptides with defined modifications, and peptides will any other modifications. By default, the common artifactual modifications methionine oxidation and n-terminal acetylation are defined for the second group (see figure below), but if another modification is abundant in the data, it should be added as well.
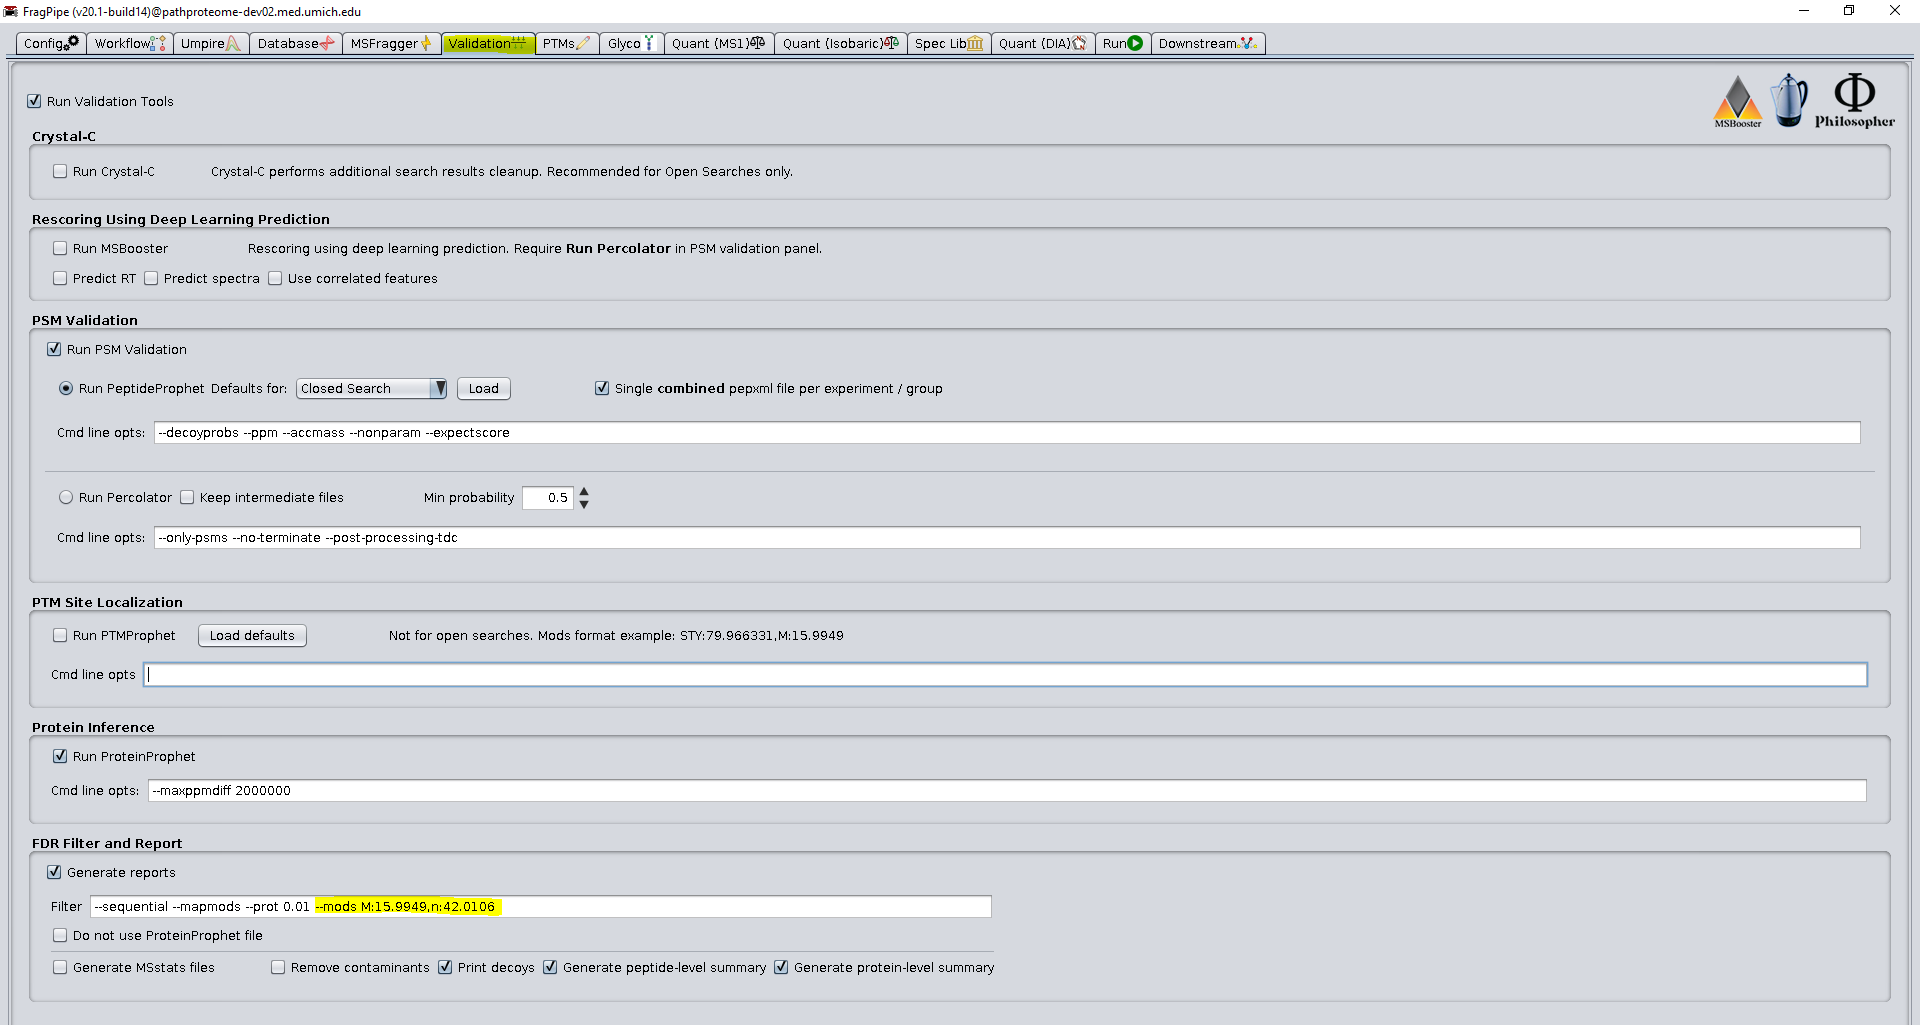
This grouping allows the FPOP modifications to be FDR controlled separately from peptides with very common artifacts that have a smaller search space. If a modification is very frequent in the data (present in more than 5-10% of the PSMs), or is present at much high levels than the FPOP modifications, it should likely be added to the defined modifications list. In our example, we also include N-terminal acetylation in the defined group due to its moderate abundance and relatively limited expansion of the search space.
5. Understanding results
To understand FragPipe outputs in general please go here. In the FPOP workflow, mass offsets are reported as variable modifications. The user can determine if a PSM contains FPOP modification by looking at the “Assigned Modifications” column in psm.tsv files, as well in other FragPipe output files (if that column is included). Also, MSFragger will attempt to localize the FPOP modifications to specific site(s) within the peptide. However, there may not be sufficient evidence in all spectra to confidently locate each modification site. If multiple sites are supported by equivalent evidence, MSFragger will put the modification on the first allowed equivalent site. For modifications that were found as a mass offset, the columns MSFragger Localization, and best score with/without Delta Mass will show the best site(s) and associated scores. A future update will improve MSFragger site localization and allow the use of PTMProphet to localize FPOP modifications and provide localization probabilities for all sites.

6. Downstream Analysis
Since FragPipe v20.1, it is possible to have FragPipe generate a summary analysis of FPOP results using the FPOP quant section of the Downstream tab.
To perform these analyses, check the FPOP Quant checkbox on the Downstream Tab. NOTE: this analysis requires that quantitation was performed using IonQuant (for label-free data) or TMT-Integrator (for TMT labeled data) as part of the FragPipe workflow. See the Quant tabs in FragPipe for details.
The FPOP summary results are generated for both peptide-level and residue level. In FPOP_peptide.tsv, all overlapping peptides resulting from different cleavage sites will be grouped together and reported under the longest peptide group along with all the modifications found. The same approach is also done at the residue level (with the option to customize the site region size -see figure below). An option is provided to automatically subtract the oxidation of a control sample from FPOP irradiated samples. This is done by specifying the common label of control samples in the Control box in FragPipe, as well as the common label for FPOP samples in the FPOP box. FragPipe will automatically match the rest of the samples labels so the right counterpart will be compared.
FPOP_peptides.tsv
Group Name Longest peptide covered by all overlapping peptides.
Protein protein sequence header corresponding to the identified peptide sequence; this will be the selected razor protein if the peptide maps to multiple proteins (in this case, other mapped proteins are listed in the ‘Mapped Proteins’ column).
Protein ID UniProt protein identifier (primary accession number).
Entry Name entry name for the selected protein.
Gene gene name for the selected protein.
Protein Description name of the selected protein.
Mapped Proteins additional proteins the identified peptide maps to (including any arising from I/L substitutions).
Mapped Genes additional genes the identified peptide may originate from (including any arising from I/L substitutions).
Peptide Sequence peptide amino acid sequence, no modifications included (‘stripped’ peptide sequence).
Start Residue number of the start of the peptide in the intact protein sequence.
End Residue number of the end of the peptide in the intact protein sequence.
FPOP Mods All FPOP modifications found in all the overlapping peptides.
Other Mods Other modifications found in the overlapping peptides (e.g Cys carbamidomethylation).
Spectral counts per experiment number of corresponding PSMs.
FPOP_sites.tsv
Group Name UniProt protein identifier (primary accession number)_site location in protein sequence.
Protein protein sequence header corresponding to the identified peptide sequence; this will be the selected razor protein if the peptide maps to multiple proteins (in this case, other mapped proteins are listed in the ‘Mapped Proteins’ column).
Protein ID UniProt protein identifier (primary accession number).
Entry Name entry name for the selected protein.
Gene gene name for the selected protein.
Protein Description name of the selected protein.
Mapped Proteins additional proteins the identified peptide maps to (including any arising from I/L substitutions).
Mapped Genes additional genes the identified peptide may originate from (including any arising from I/L substitutions).
Peptide Sequence peptides use for determination of the site.
Start First position of the largest area covered by the overlapping peptides used to calculate the site.
End Last position of the largest area covered by the overlapping peptides used to calculate the site.
FPOP Mods All FPOP modifications found in all the overlapping peptides.
Other Mods Other modifications found in the overlapping peptides (e.g Cys carbamidomethylation).
Spectral counts per experiment number of corresponding PSMs.
7. Expected Results
The tables below shos the amount of PSMs expected for this samall tutorial dataset, as well as the quantitative resuls for a peptide in output file FPOP_peptides.tsv (substracting background oxidation).
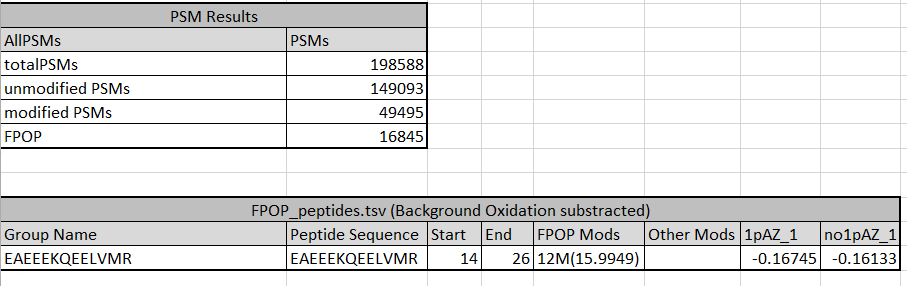
It is recommended to review this tutorial with the whole dataset and compared to the results in the publication.