Example Glycoproteomics Analysis with FragPipe
This example will show a complete glycoproteomics workflow analyzing a real dataset. The data is from the paper Integrated N-glycoproteomics Analysis of Human Saliva for Lung Cancer, which can be referenced as a guide.
Preparation
Install FragPipe if you have not done so already (instructions can be found here)
Download the raw data from ProteomeXchange(https://proteomecentral.proteomexchange.org/cgi/GetDataset?ID=PXD030670) or PRIDE (https://www.ebi.ac.uk/pride/archive/projects/PXD030670). These 6 raw files need to be downloaded:
- HILIC-normal-Intact_glycopeptides-1.raw
- HILIC-normal-Intact_glycopeptides-2.raw
- HILIC-normal-Intact_glycopeptides-3.raw
- HILIC-cancer-Intact_glycopeptides-1.raw
- HILIC-cancer-Intact_glycopeptides-2.raw
- HILIC-cancer-Intact_glycopeptides-3.raw
Set up the FragPipe Run
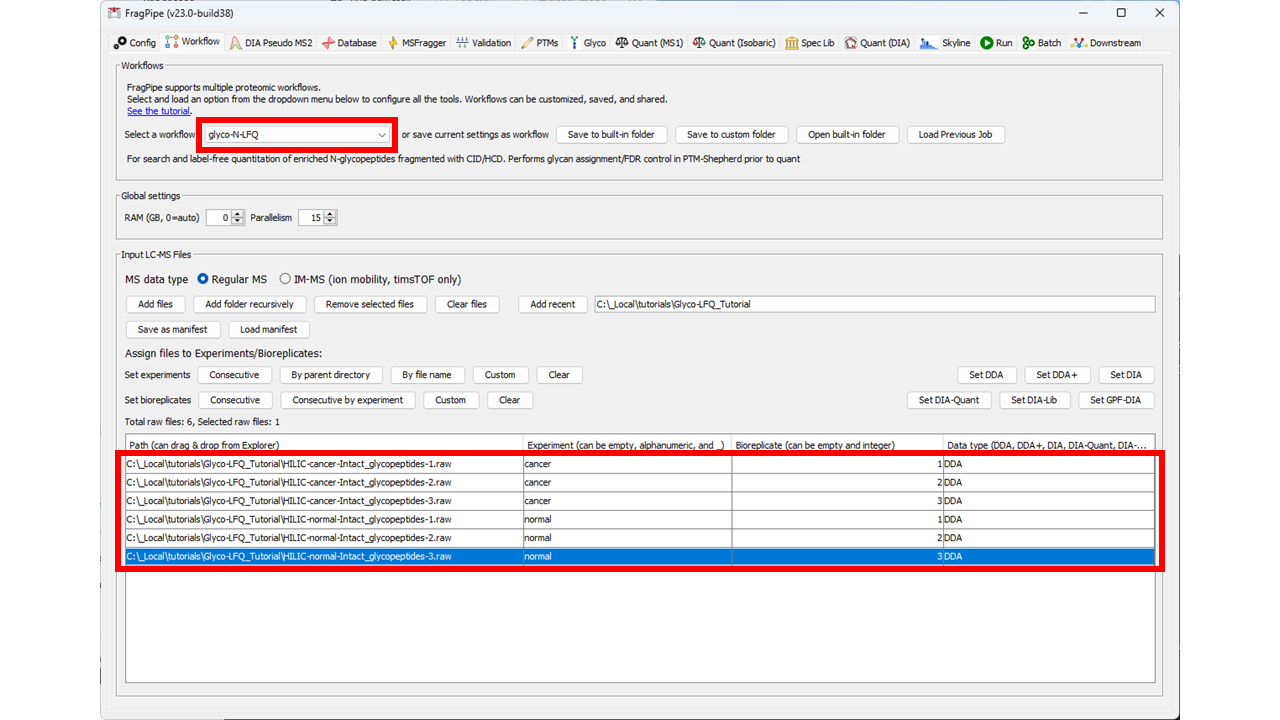
1) Load the glyco-N-LFQ workflow from the workflows menu on the Workflow tab (see the highlighted red box at the top of the screenshot below) 2) Load the .raw files to the LC-MS files table (using the Add Files button) and set the experiments and replicates as shown in the screenshot to distinguish the cancer and normal samples into separate experiments.
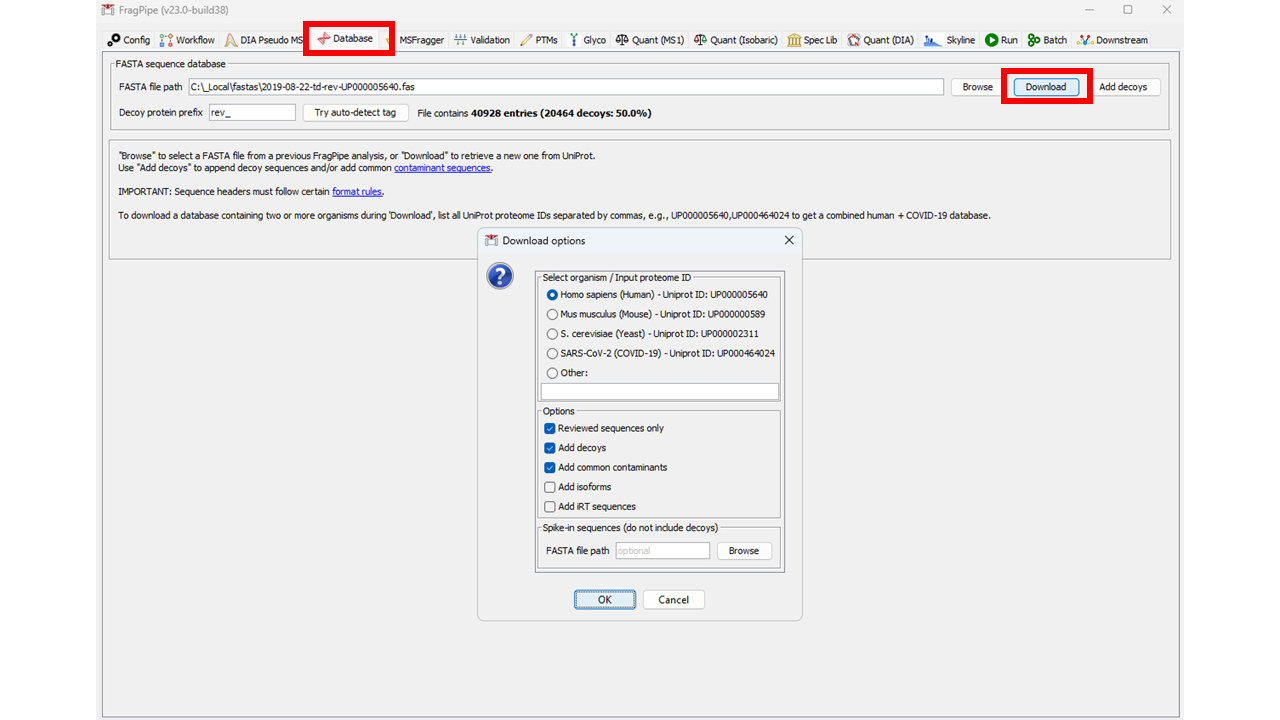
3) Load a protein FASTA on the Database tab. You can use a previous human fasta, or use the Download button to download a new one. If downloading, use the default settings (Human, review sequences only, add decoys, and add common contaminants).
4) (optional) Adjust any parameters. The default glyco-N-LFQ parameters are a good starting point for this analysis, so nothing needs to be changed prior to running. However, for other analyses, common areas to adjust are listed below (see the glyco settings tutorial for details):
- Load a different glycan list on the Glyco tab
- Enable Match Between Runs (MBR) on the Quant (MS1) tab. This will reduce the number of missing values in the output using the MBR algorithm.
- Generate a Skyline document to view the results in a different way or to use for alternative quantification. To do so, check the "Generate Skyline Document" box on the Skyline tab, and set the "Special Modifications Mode" to "N-glyco".
- Change the ion types for a different activation method on the MSFragger tab. For example, if analyzing EThcD data, the ion types should be b,y,c,z,Y instead of b,y,Y.
5) Run the Search by going to the Run tab, setting the output directory (where the results will be saved) and clicking “RUN”. The progress of the search will be displayed as it proceeds. For the default parameters, the search should take about 5-15 minutes (depending on the speed of your computer).
Analyze the Results
There are several different outputs that can be used to examine the identified peptides and glycopeptides:
- Quantified glycopeptides can be found in the combined_modified_peptide.tsv table.
- Click the Open FragPipe-PDV viewer button on the Run tab to see the matched MS2 spectra for individual PSMs. For glycoPSMs, using the menu items below the spectrum, select “Other” / “Glycan B/Y” and “Other” / “Glycan: HexNAc remainder” to see the glycopeptide-specific fragment ions annotated on the spectra.
- PSMs can also be examined in table form using the psm.tsv tables inside each experiment folder in the results. The psm.tsv has all the match and score information for the peptide and glycan.
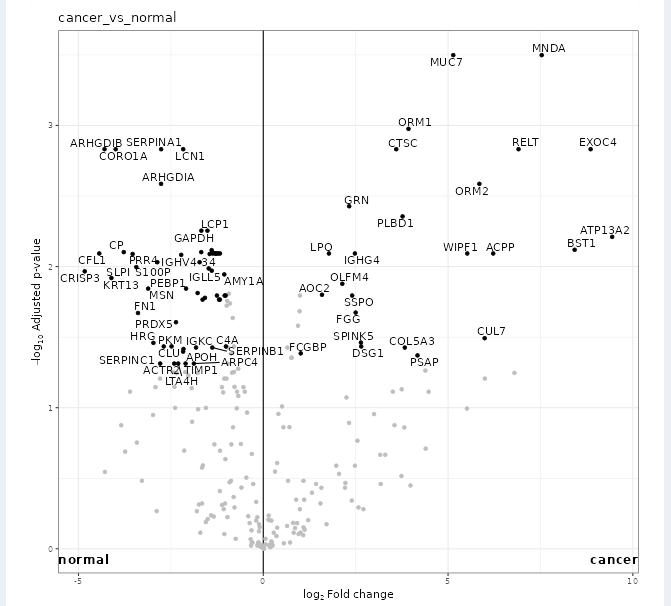
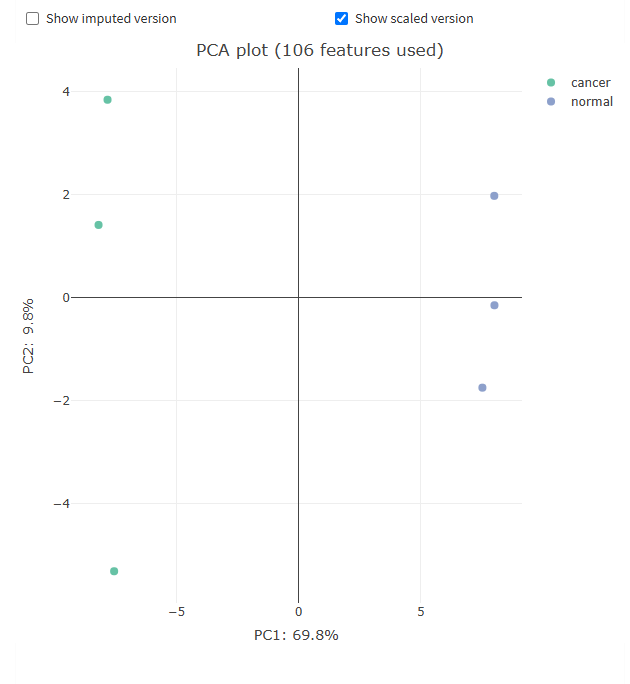
To generate volcano and PCA plots similar to figures S9 and S10 in the paper, we will use FragPipe-Analyst. Note that FragPipe-Analyst does not yet support glycopeptide-level results, so we will generate protein-level plots. Glycopeptide-level quant results are available in the combined_modified_peptide.tsv table.
- Click the Open FragPipe-Analyst button on the Run tab to navigate to FragPipe-Analyst (it will open in a web browser).
- Set the mode to “LFQ”
- Upload the combined_protein.tsv and experiment_annotation.tsv files from your results folder and click Run.
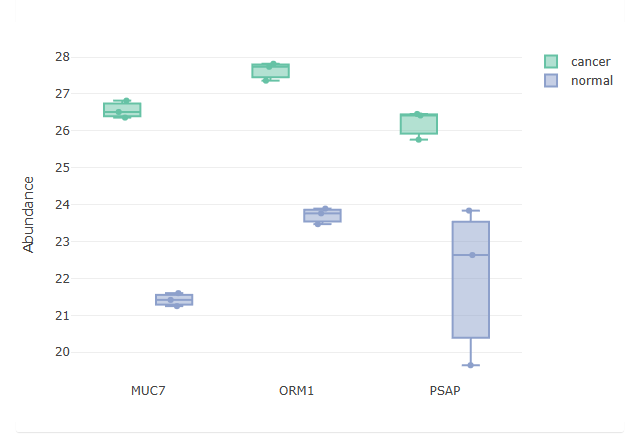
- Example plots are shown below. The volcano plot shows glycoprotein expression differences between the cancer and normal samples, the PCA plot shows the ability to separate cancer and normal samples from the protein level data, and 3 selected differentially expressed glycoproteins are highlighted in the feature table, showing the difference in detected abundance between cancer and normal samples.