TMT analyses with FragPipe
FragPipe currently includes two tools for generating TMT quantification reports. For most workflows, it is recommended to use TMT-Integrator, which filters and combines isobaric quantification information (from psm.tsv reports generated by Philosopher) into reports at many levels: gene, protein, peptide, and modification site. It can be used on a single multiplexed sample (e.g. one TMT 10-plex) or to integrate quantification information across many multiplexed samples, with the option to use a pooled reference channel (or a virtual one if a pooled reference channel has not been included in the experiment). This tutorial analyzes a single TMT10-labeled sample (a single ‘plex’), see this tutorial on analyzing multiple plexes and PTM site-specific quantification reports. The alternative is to use peptide/protein-level TMT quantification reports produced by Philosopher (e.g. protein.tsv, or combined_protein.tsv file when using multiple plexes).
Tutorial contents
- Download data
- Start FragPipe
- Set workflow and load files
- Fetch database
- MSFragger search settings
- Validation settings
- Quantification settings
- Run the analysis
- Results
Download data
For this tutorial, we will use a publicly-available LC-MS spectral file from a single fraction (01_CPTAC_TMTS1-NCI7_P_JHUZ_20170509_LUMOS.mzML) of a TMT 10-plex human cell line sample described in this publication, which you can download from PRIDE. The full experiment listing is here. Place the mzML file in a new folder named ‘TMT_tutorial’.
Start FragPipe
Find the fragpipe folder and open the fragpipe/bin subfolder. Double-click the fragpipe.exe file on Windows (or the fragpipe file on Linux) to launch the FragPipe program. See this page for help configuring FragPipe. Once MSFragger, IonQuant, and Philosopher are configured, you are ready to start your analysis.
Set workflow and load files
On the ‘Workflow’ tab in FragPipe, select the ‘TMT10’ workflow from the dropdown menu and click ‘Load’. Then drag and drop 01_CPTAC_TMTS1-NCI7_P_JHUZ_20170509_LUMOS.mzML into the input file section.
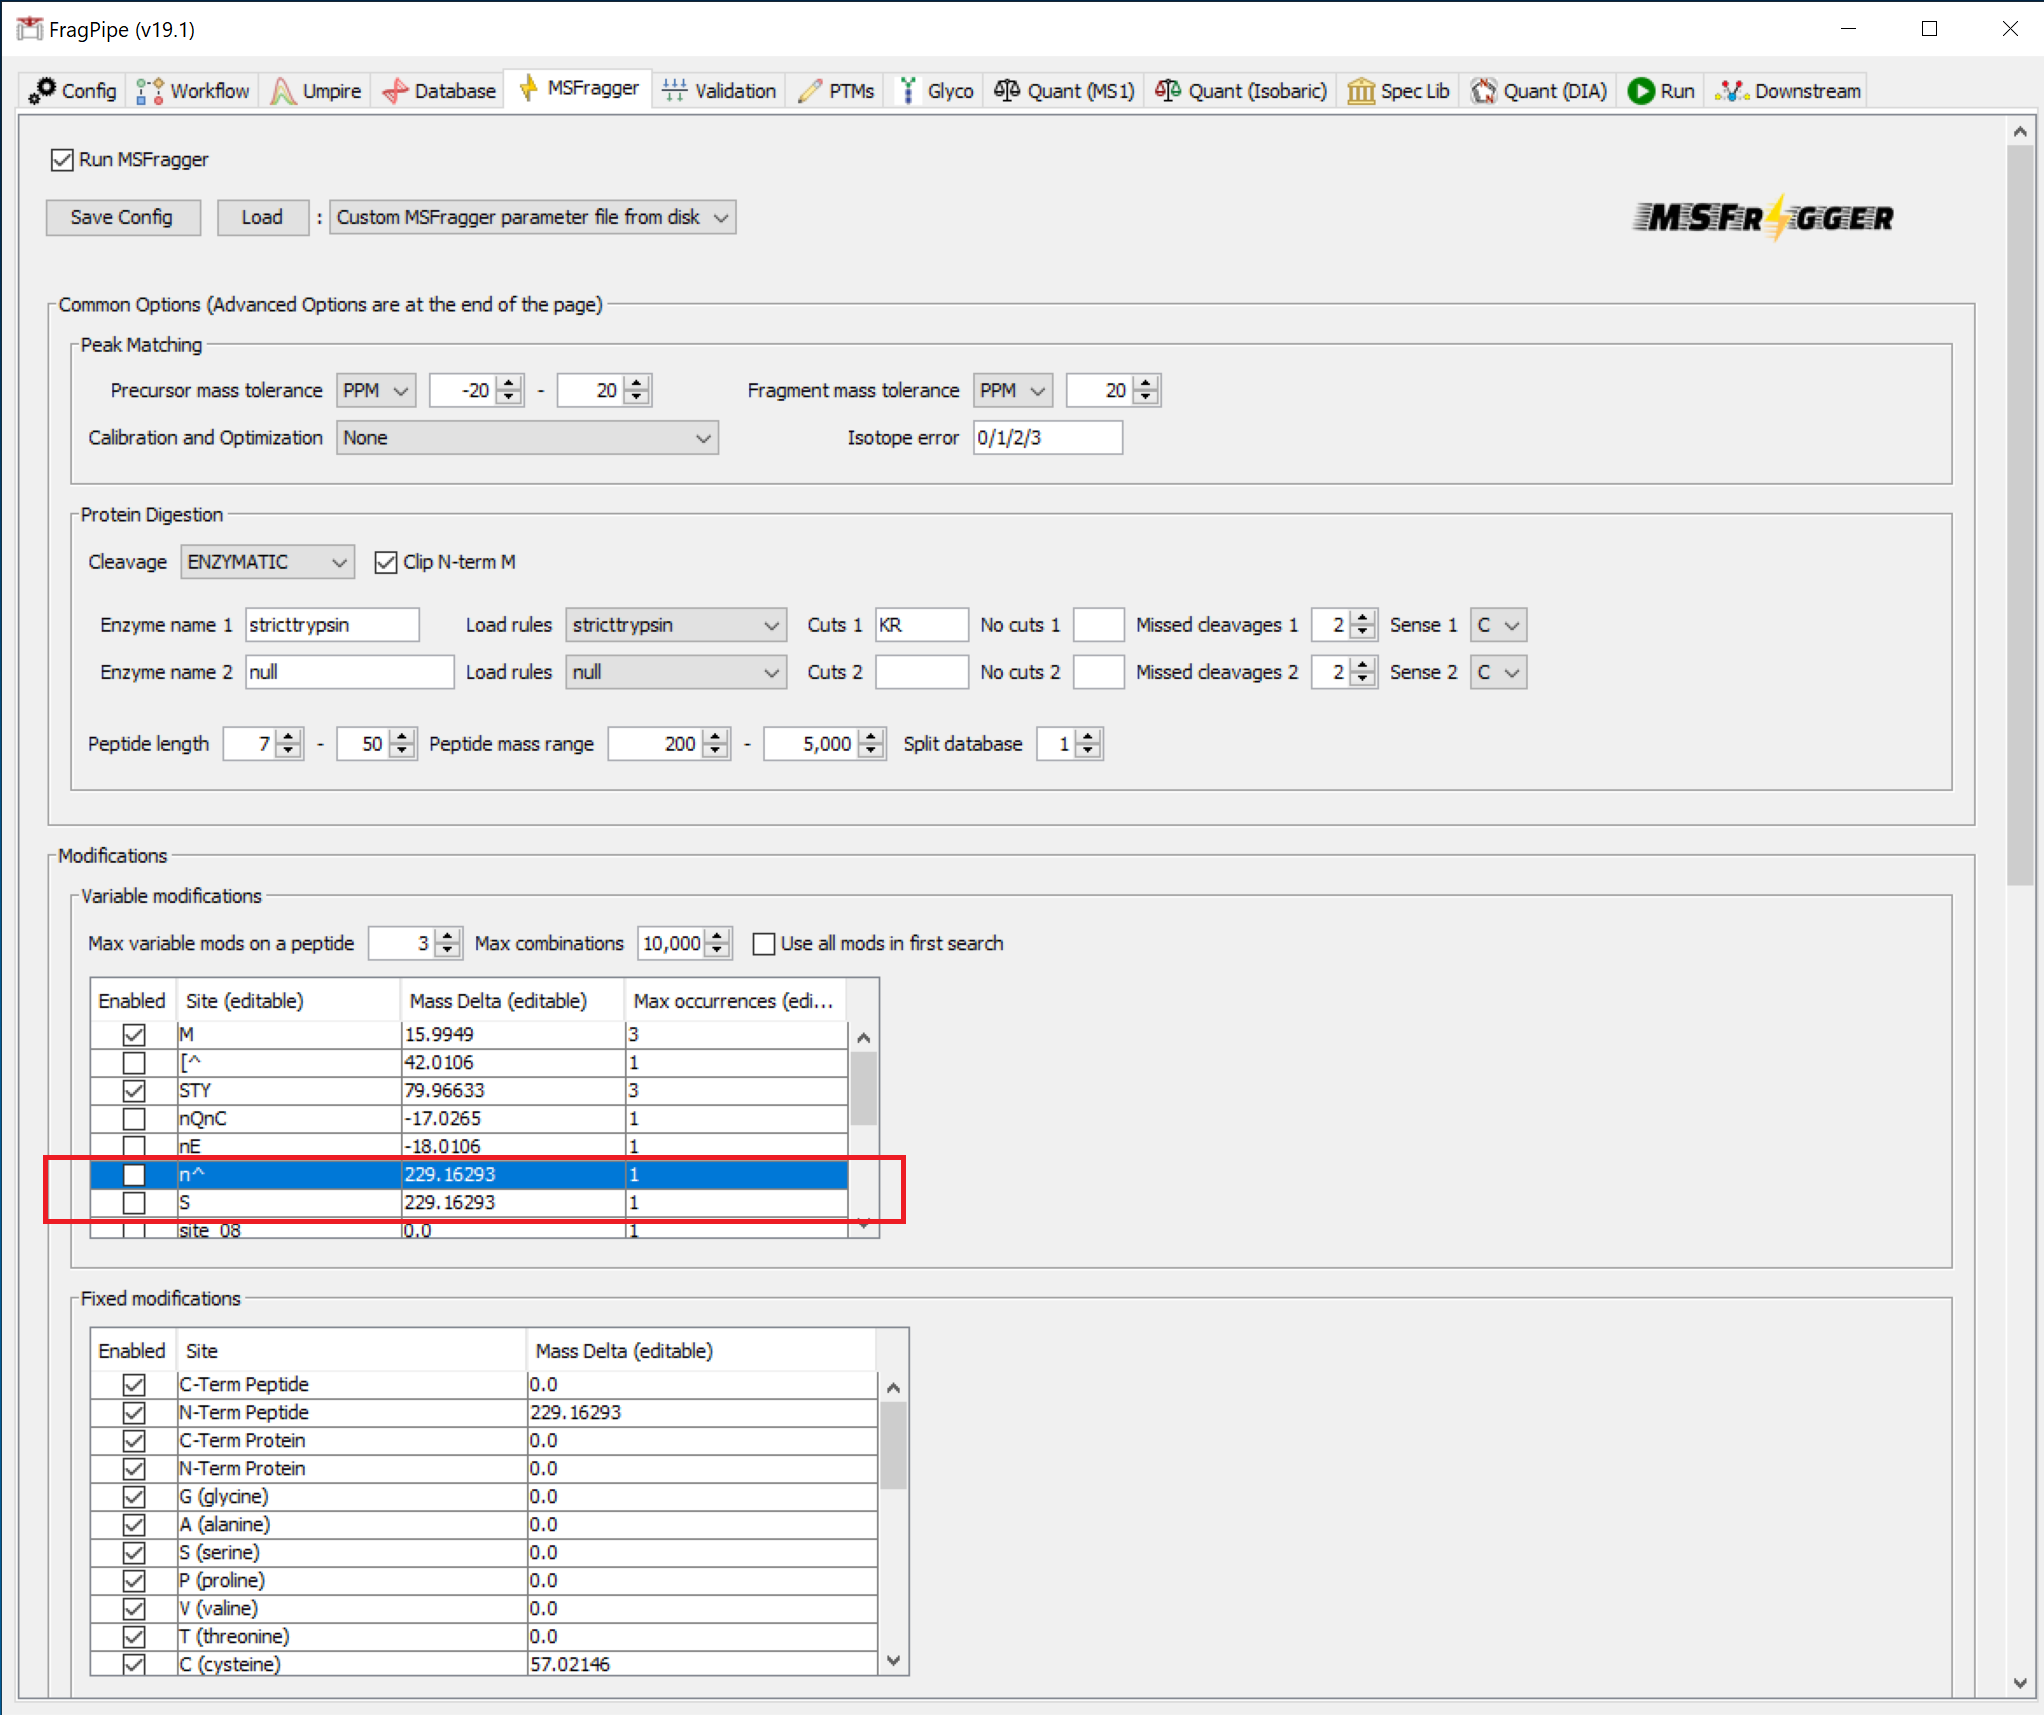
Workflows for TMT-labeled phosphopeptides are also available. These workflows include the variable +79.9663 STY in the MSFragger search, phospho localization settings for PTM-Prophet, and settings in TMT-Integrator that will generate phosphosite-specific quantification reports.
If you have more than one multiplexed sample, each sample needs to be placed in a separate directory. E.g., if an experiment consists of three different TMT-10 samples (A, B, C) each with 12 high-pH RPLC fractions, there should be three folders (‘A’, ‘B’, ‘C’) with 12 mzML files and one channel annotation file in each.
Fetch database
On the ‘Database’ tab, click ‘Download’, which will first prompt you to specify a download location, which you can set to be the ‘TMT_tutorial’ folder. After you ‘Select directory’, use the default settings to fetch a database from UniProt (reviewed human sequences plus decoys and common contaminants).
MSFragger search settings
For this tutorial, the parameters on the ‘MSFragger’ tab automatically loaded with the TMT10 workflow do not need to be modified. In other situations, variable modifications or other parameters could be adjusted here. Check that the TMT tag masses (+229.1629 for TMT-10 in this case) are set correctly for your experiment.
Validation settings
For the dataset in this tutorial, the settings on the ‘Validation’ tab do not need to be modified.
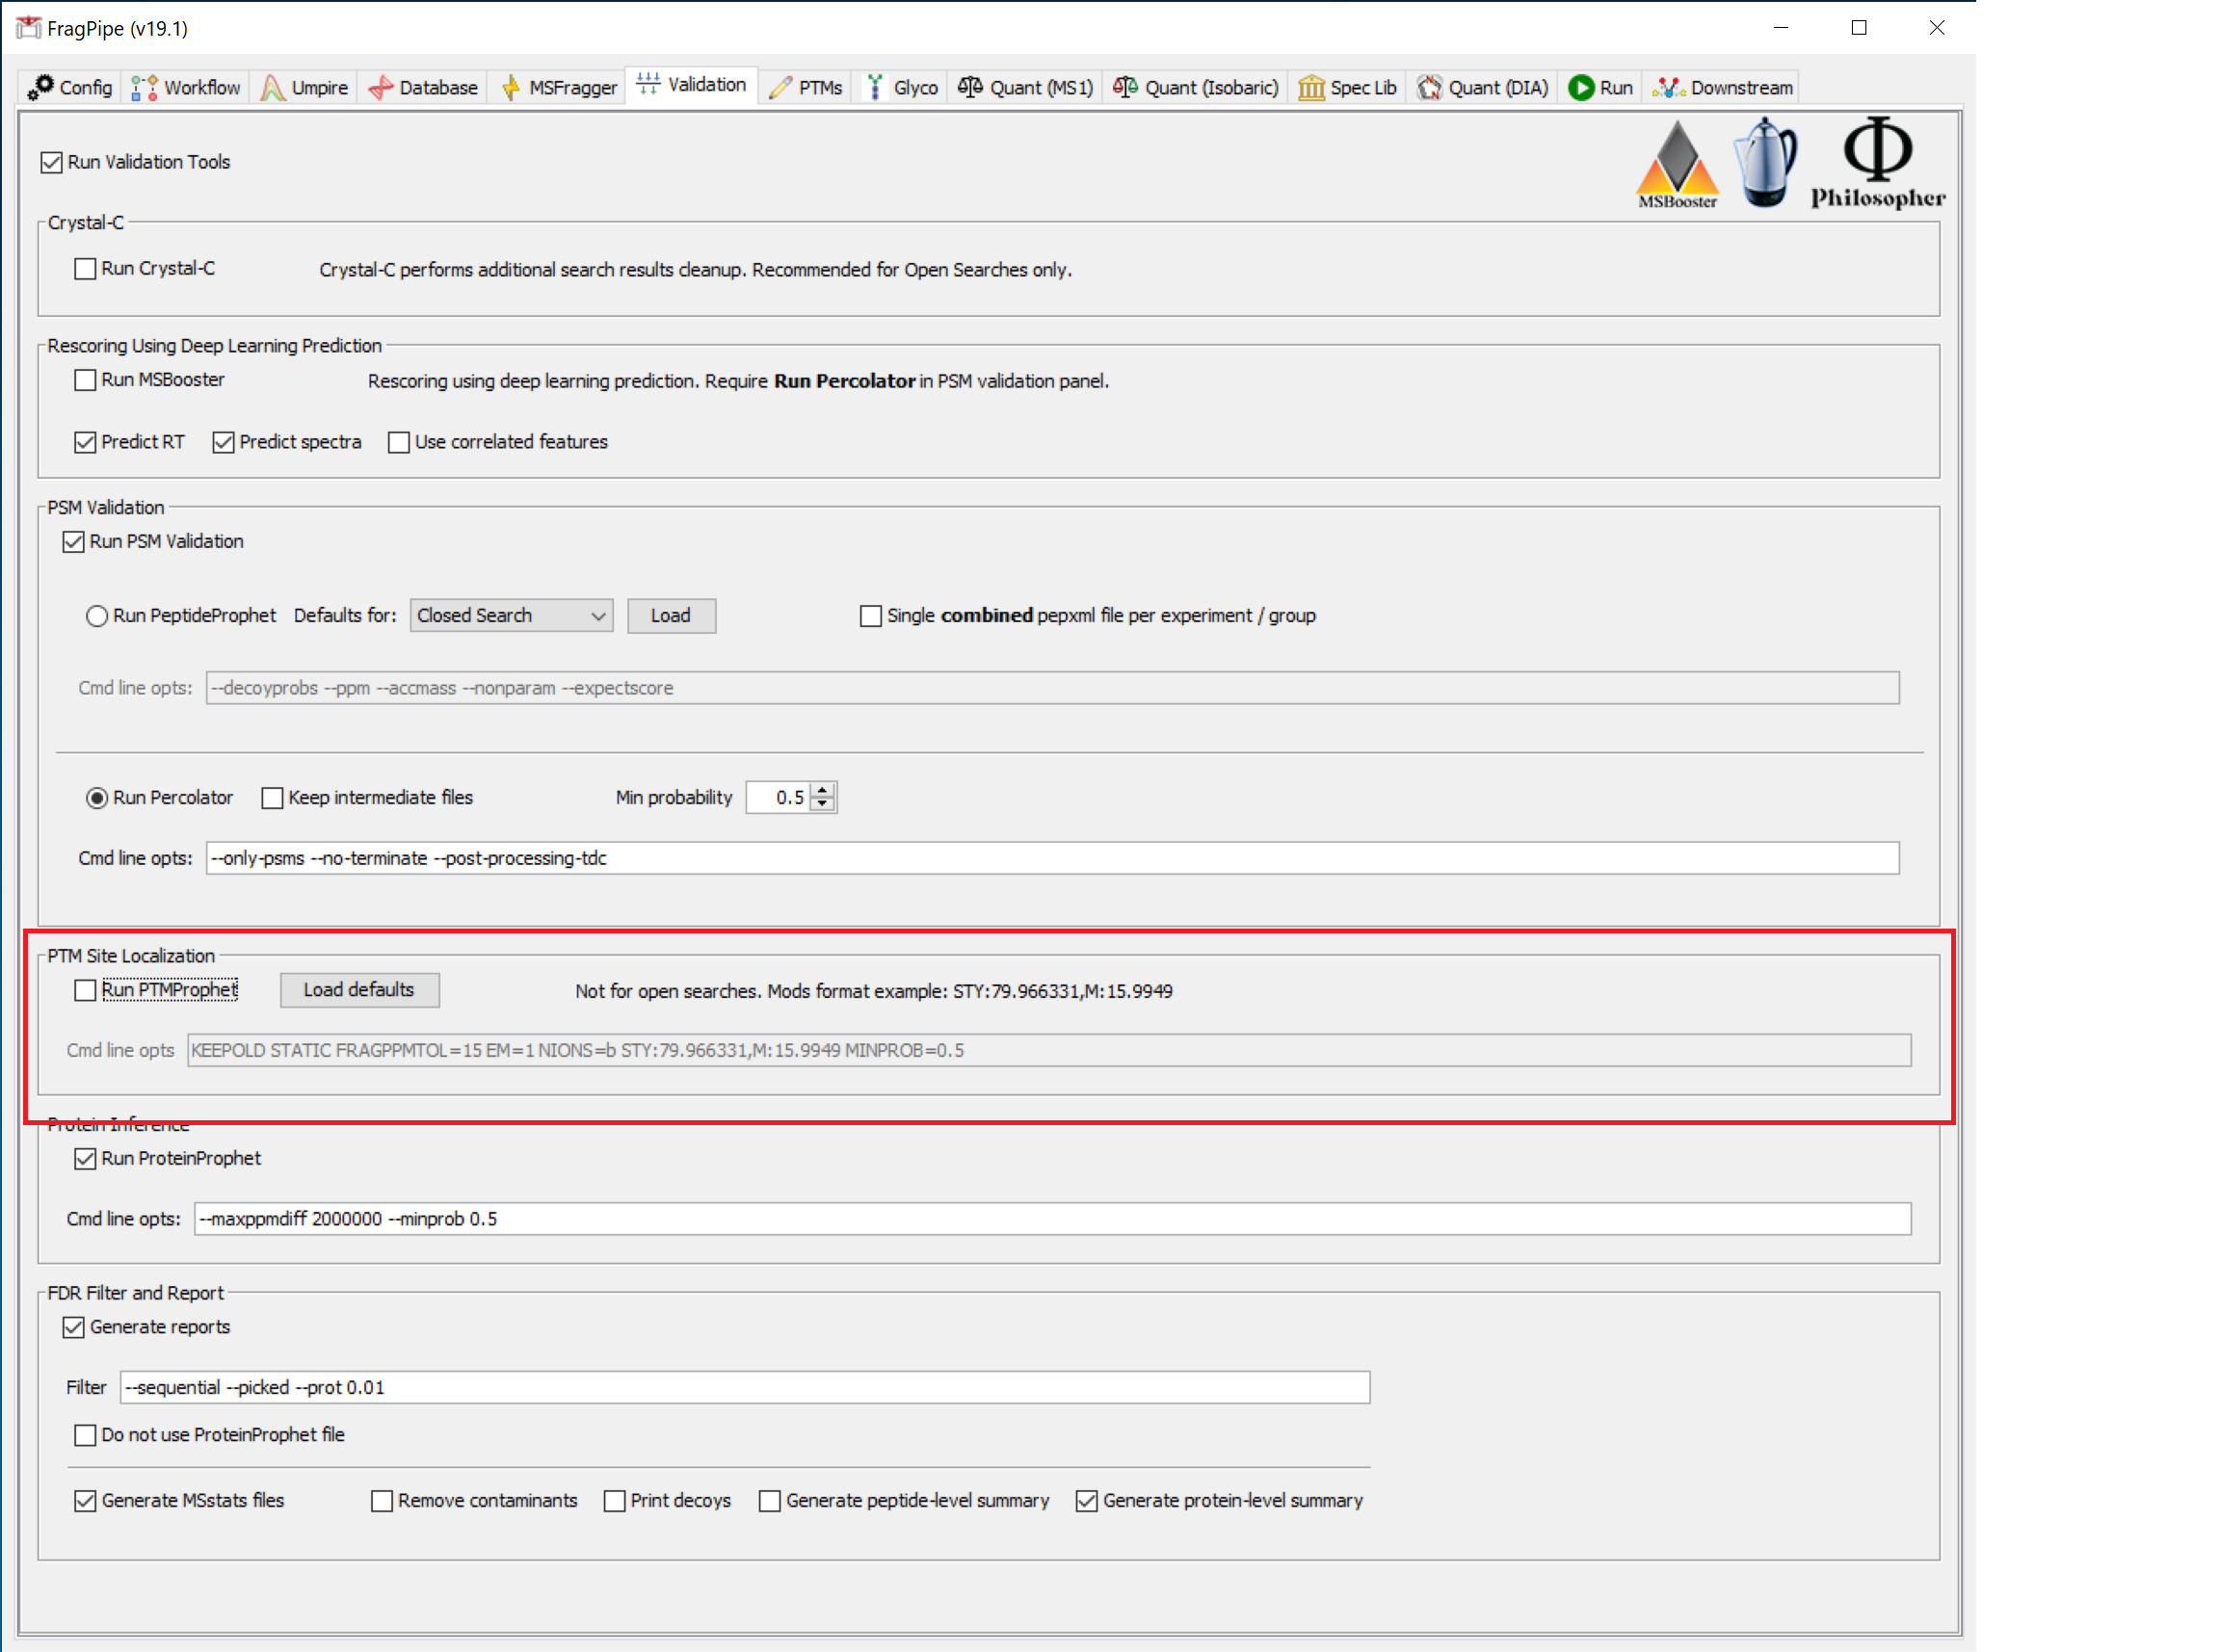
To quantify localized phosphorylation sites (or other PTMs), PTM-Prophet is used. In those cases, PTM-Prophet parameters need to be set on this tab following this example for phosphorylation:
--keepold --static --fragppmtol 15 --em 1 --nions b --mods STY:79.966331,M:15.9949 --minprob 0.5
where modification masses are specified with their respective modified residues. Modification masses specified here for PTM-Prophet should exactly match those set in the Variable modifications section of the MSFragger tab.
Quantification settings
In the ‘Quant (Isobaric)’ tab, click the ‘Edit/Create’ button in the ‘Sample/Channel Annotation’ section. In the pop-up window, ensure ‘TMT-10’ is selected from the dropdown and click ‘Load into table’. Sample names can now be edited, and will be automatically saved as an annotation.txt file in the sample folder. Instead of naming samples/channels in FragPipe using Edit/Create, you can make annotation files in advance (as long as the file names end in ‘annotation.txt’), which FragPipe will load automatically if it is in the same folder as the corresponding mzML files. When creating these files, make sure the value in first column (channel) and in the second column (sample name) are separated with a space.
Note: To ignore certain channel in the normalization and TMT report, set the corresponding sample name to NA.
If a dataset is composed of more than one multiplexed sample, reference samples should be defined so quantification information from multiple plexes can be integrated. Choose ‘Virtual’ reference from the ‘Define reference’ dropdown if no reference sample has been included in the experiment. Real pooled samples or other reference channels should be labeled with ‘pool’ or a different tag specified in the ‘Ref sample tag’ box.
From the ‘Group by’ menu, choose the desired level for quantification reports, or select ‘All’ to generate reports at all levels.
Median centering normalization is recommended and set as the default.
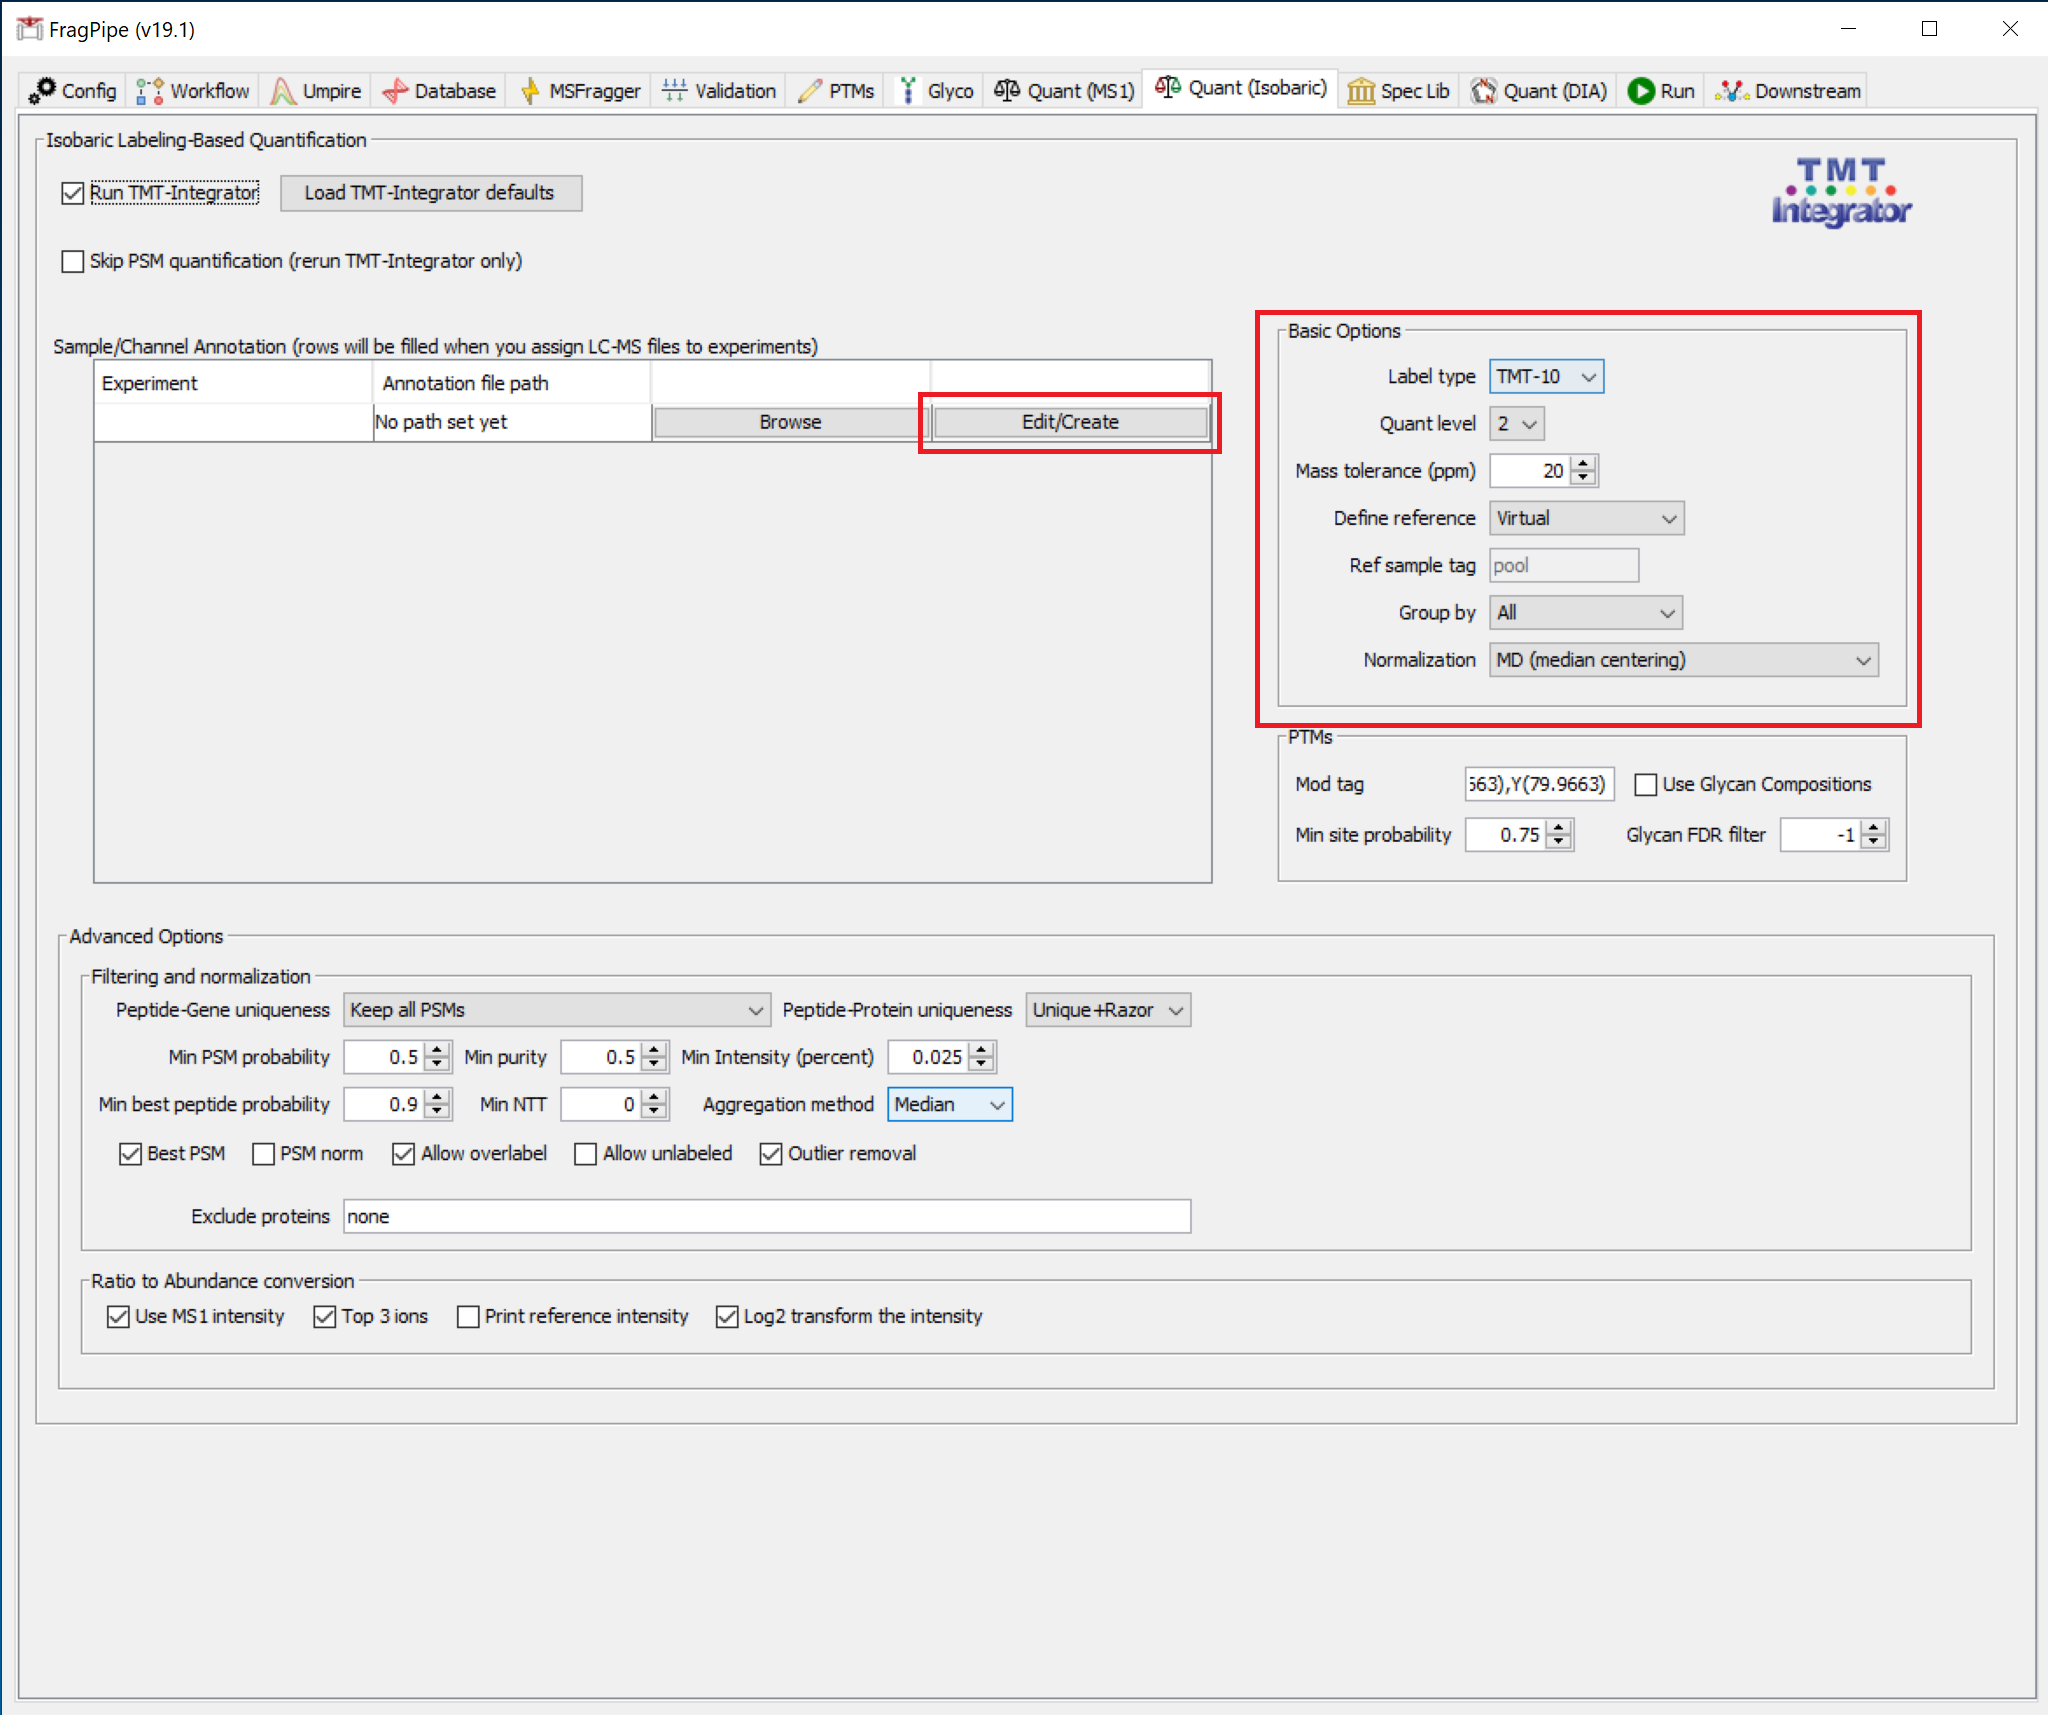
In the PTMs section (on the ‘Quant’ tab), ‘Mod tag’ needs to be set for the modification of interest. Mod tags consist of the modified residue plus the modification mass to four decimal places. For example, the Mod tag for phosphorylation is S(79.9663),T(79.9663),Y(79.9663) (formerly S[167],T[181],Y[243]). To use PTM-Prophet localization (Min site probability > 0), the PTMs listed in Mod tag must also be set in the Validation tab. See the phospho example below (and the corresponding PTM-Prophet/Validation settings above):
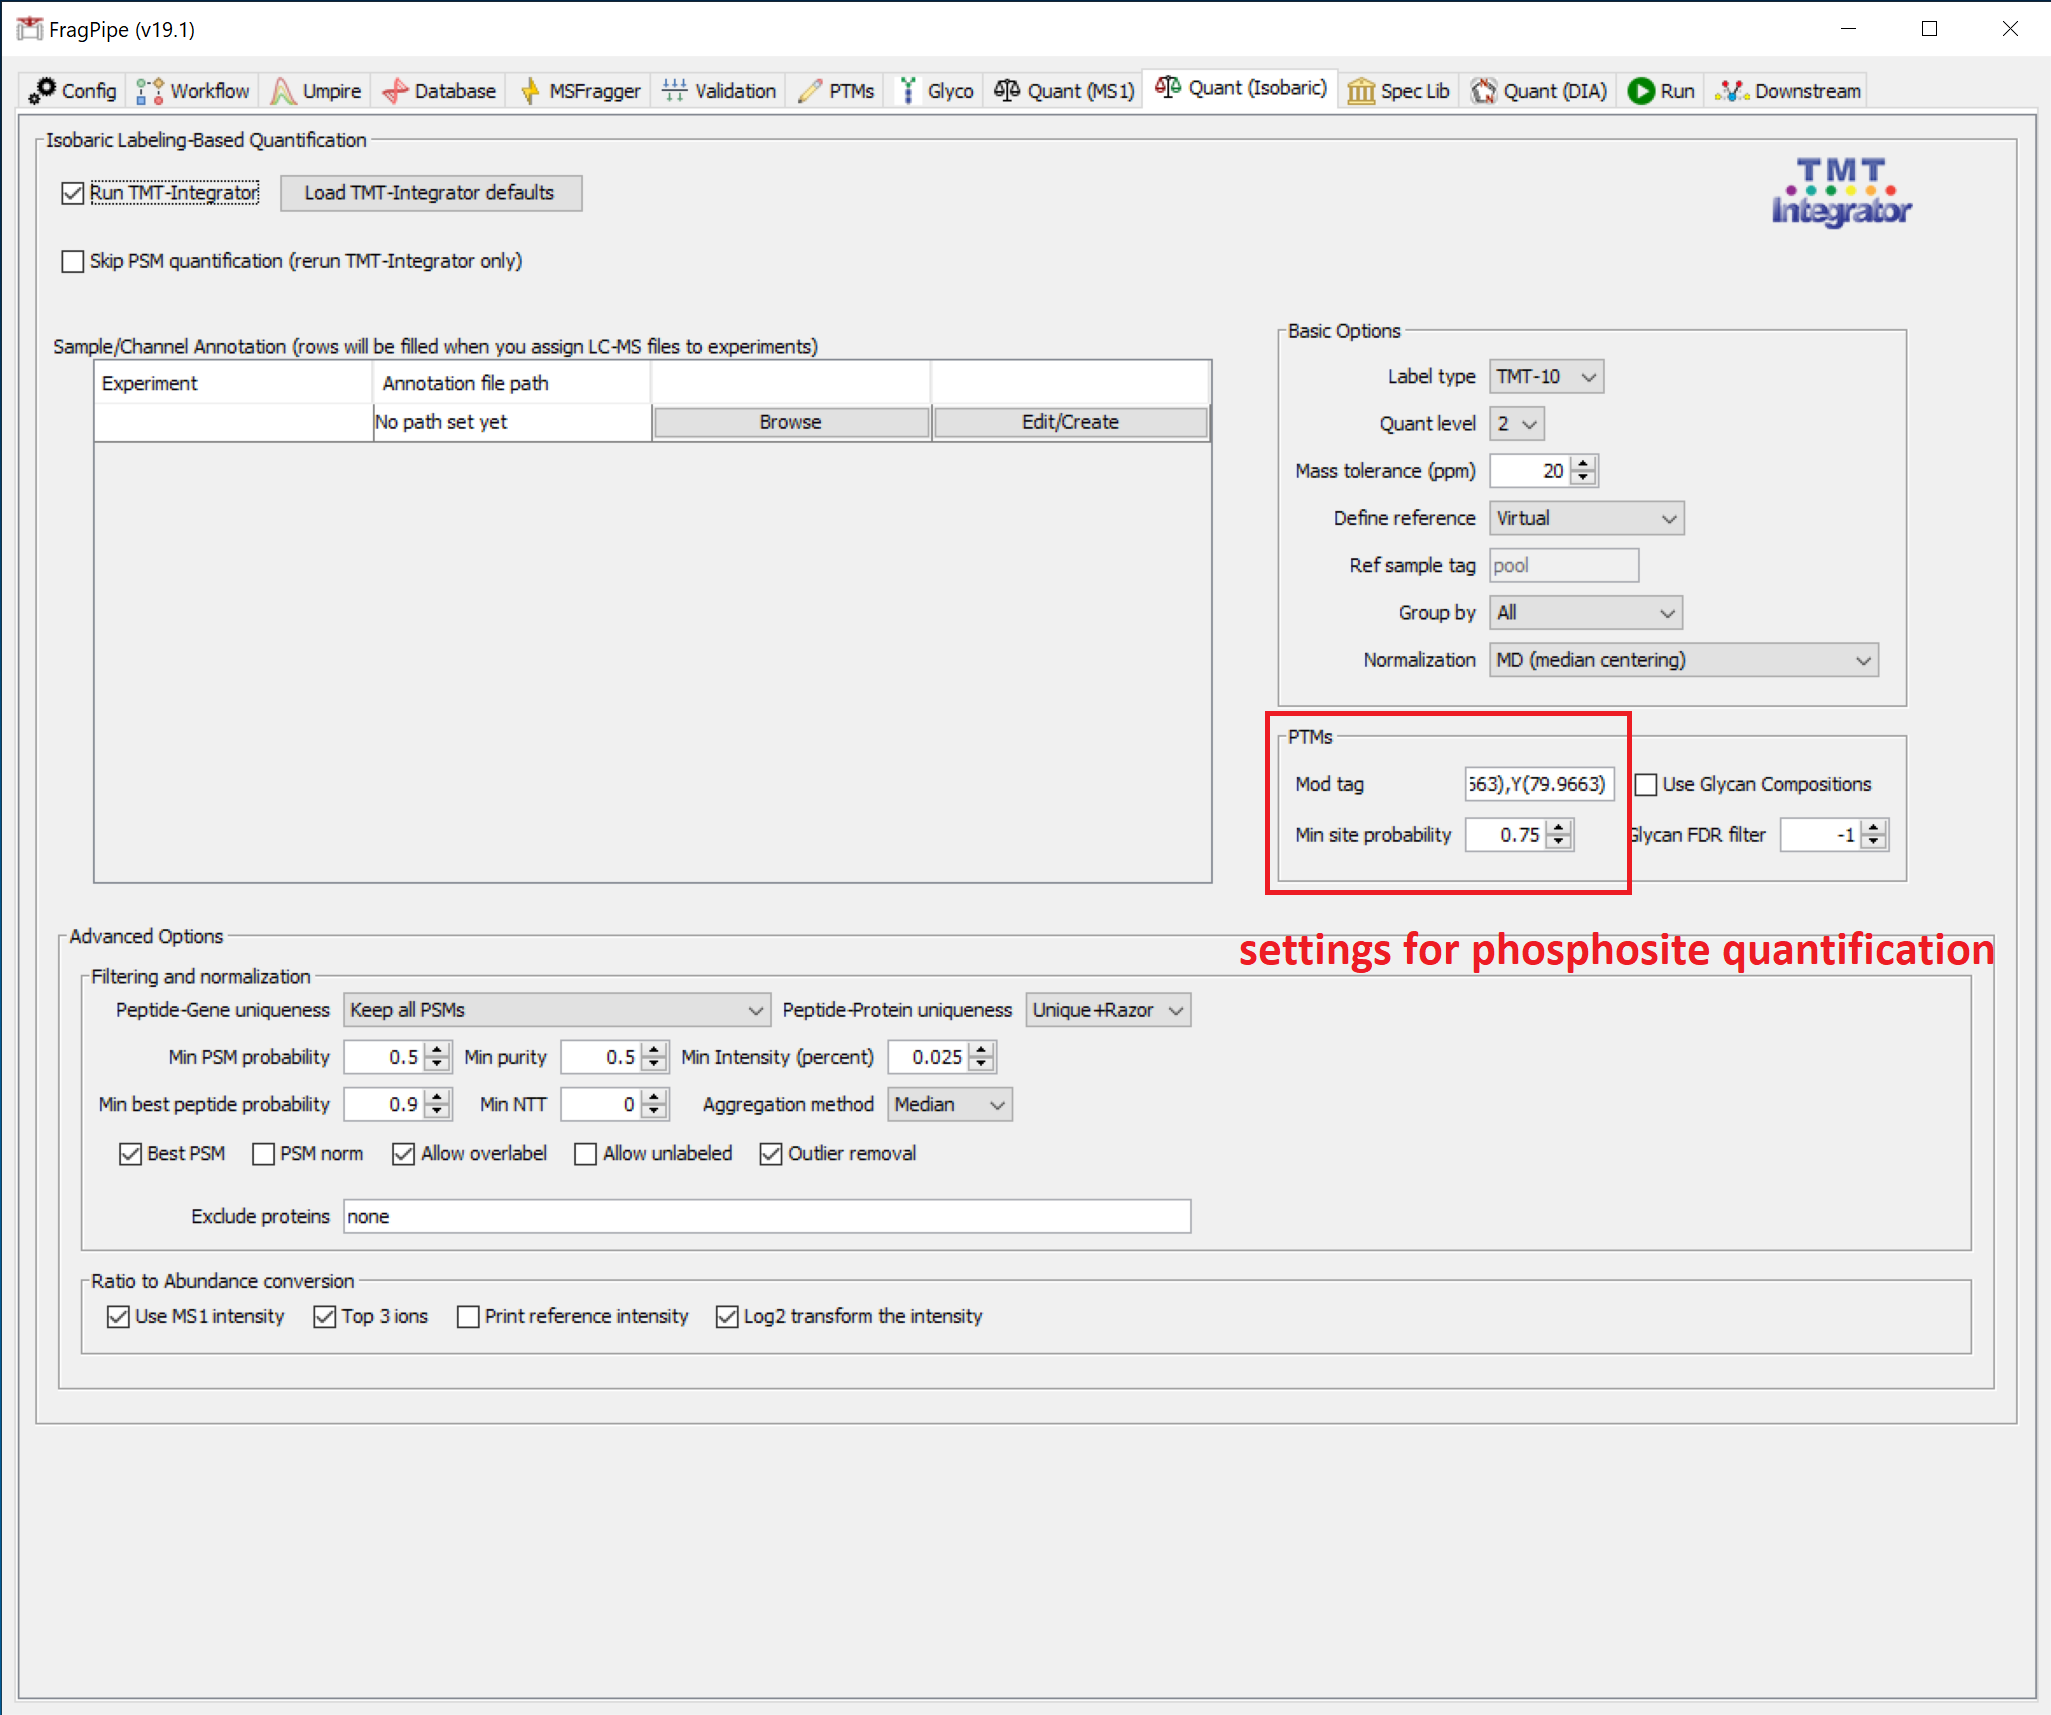
To generate reports for modified sites found by the MSFragger search regardless of whether they have been localized by PTM-Prophet (or if the PTM-Prophet step is not included in your analysis), set the ‘Min site probability’ to 0. To generate global reports (peptide, protein, and gene; no PTM site-specific reports), set ‘Min site probability’ to -1.
Run the analysis
On the ‘Run’ tab, set the output directory to a new folder within the ‘TMT_tutorial’ directory, e.g. ‘TMT_tutorial/results’, then press ‘RUN’.
Results
When the analysis is finished, identification reports with raw quantification values (psm.tsv, ion.tsv, peptide.tsv, protein.tsv) will be in the main results folder (e.g. ‘TMT_tutorial/results’). If multiple experiments were set during the file input step on the ‘Workflow’ tab, these identification reports will be in a separate folder for each experiment.
TMT-Integrator reports will be in a new folder, ‘tmt-reports’. These reports contain normalized log2-transformed values, with separate files for both abundances (intensities) and ratios at each level (gene, protein, peptide, etc.). See the TMT/iTRAQ section on this page for more details.
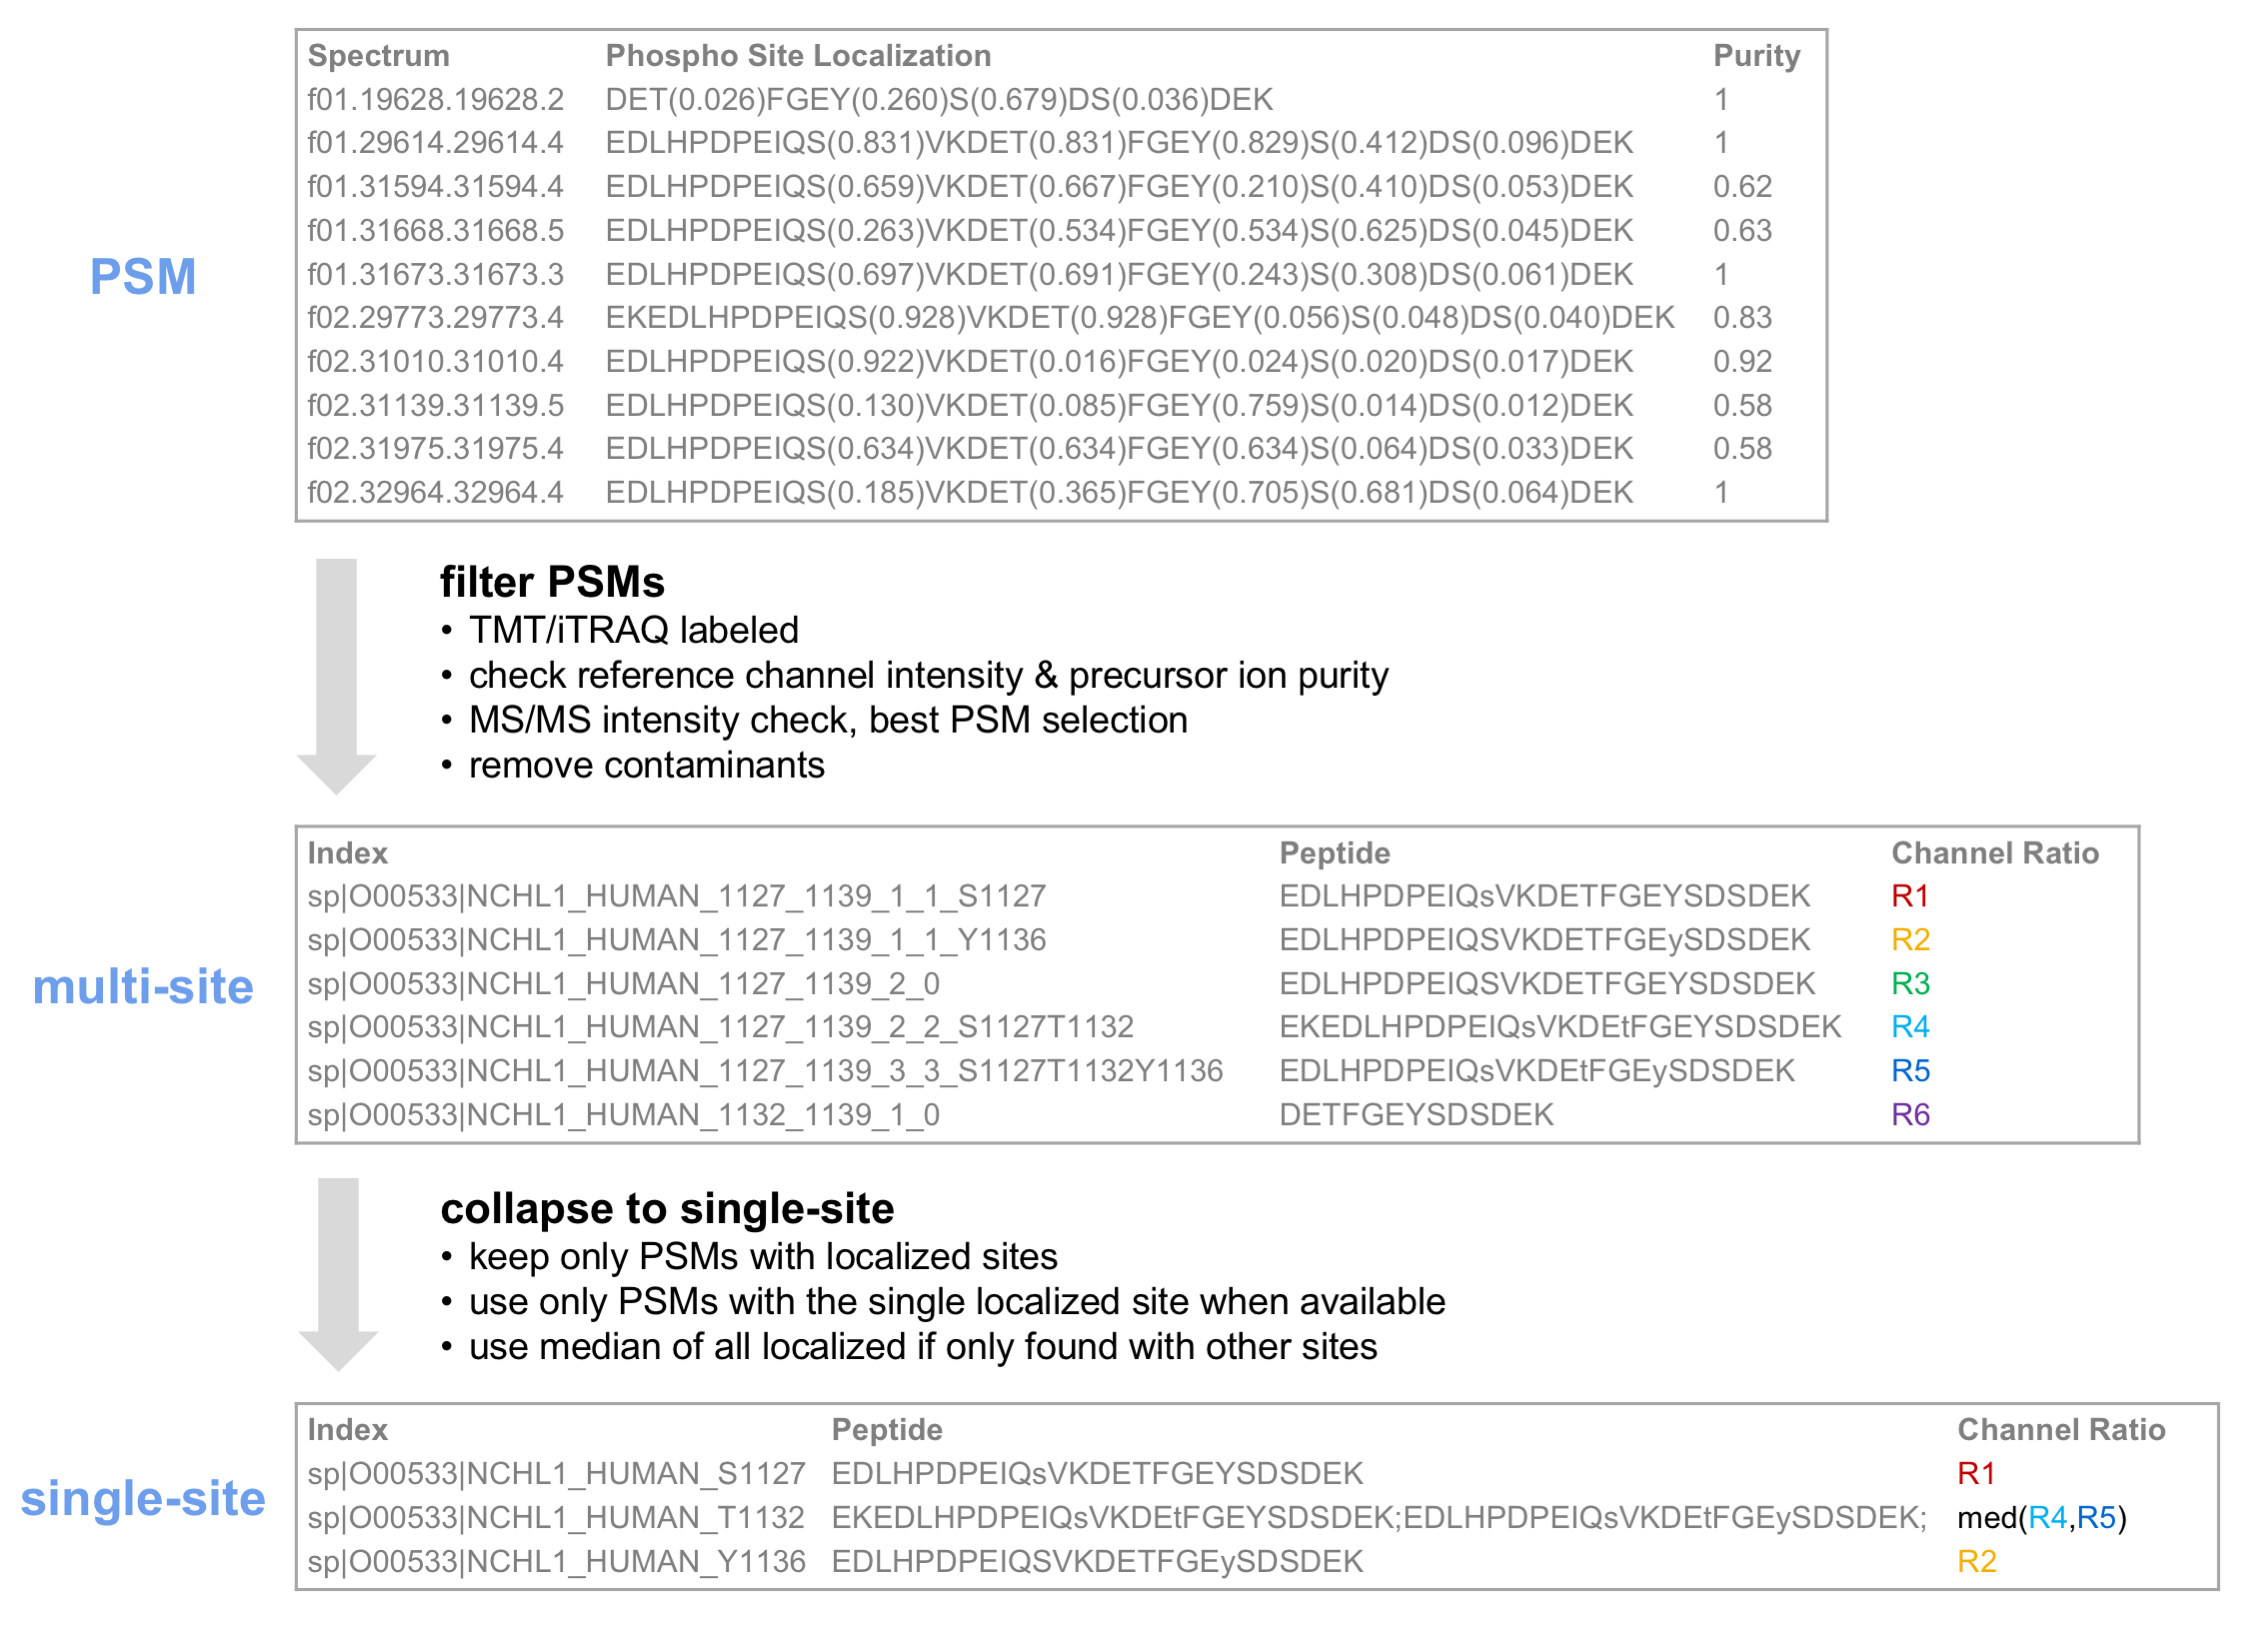
If PTM-specific quantification was performed, multi-site and single-site reports will be generated for the specified modification. In single-site reports, peptides identified with multiple specified modifications are converted to single-site form. When using PTM-Prophet for localization (supported for phosphopeptide-enriched workflows only for now), single site reports contain only confidently localized sites.
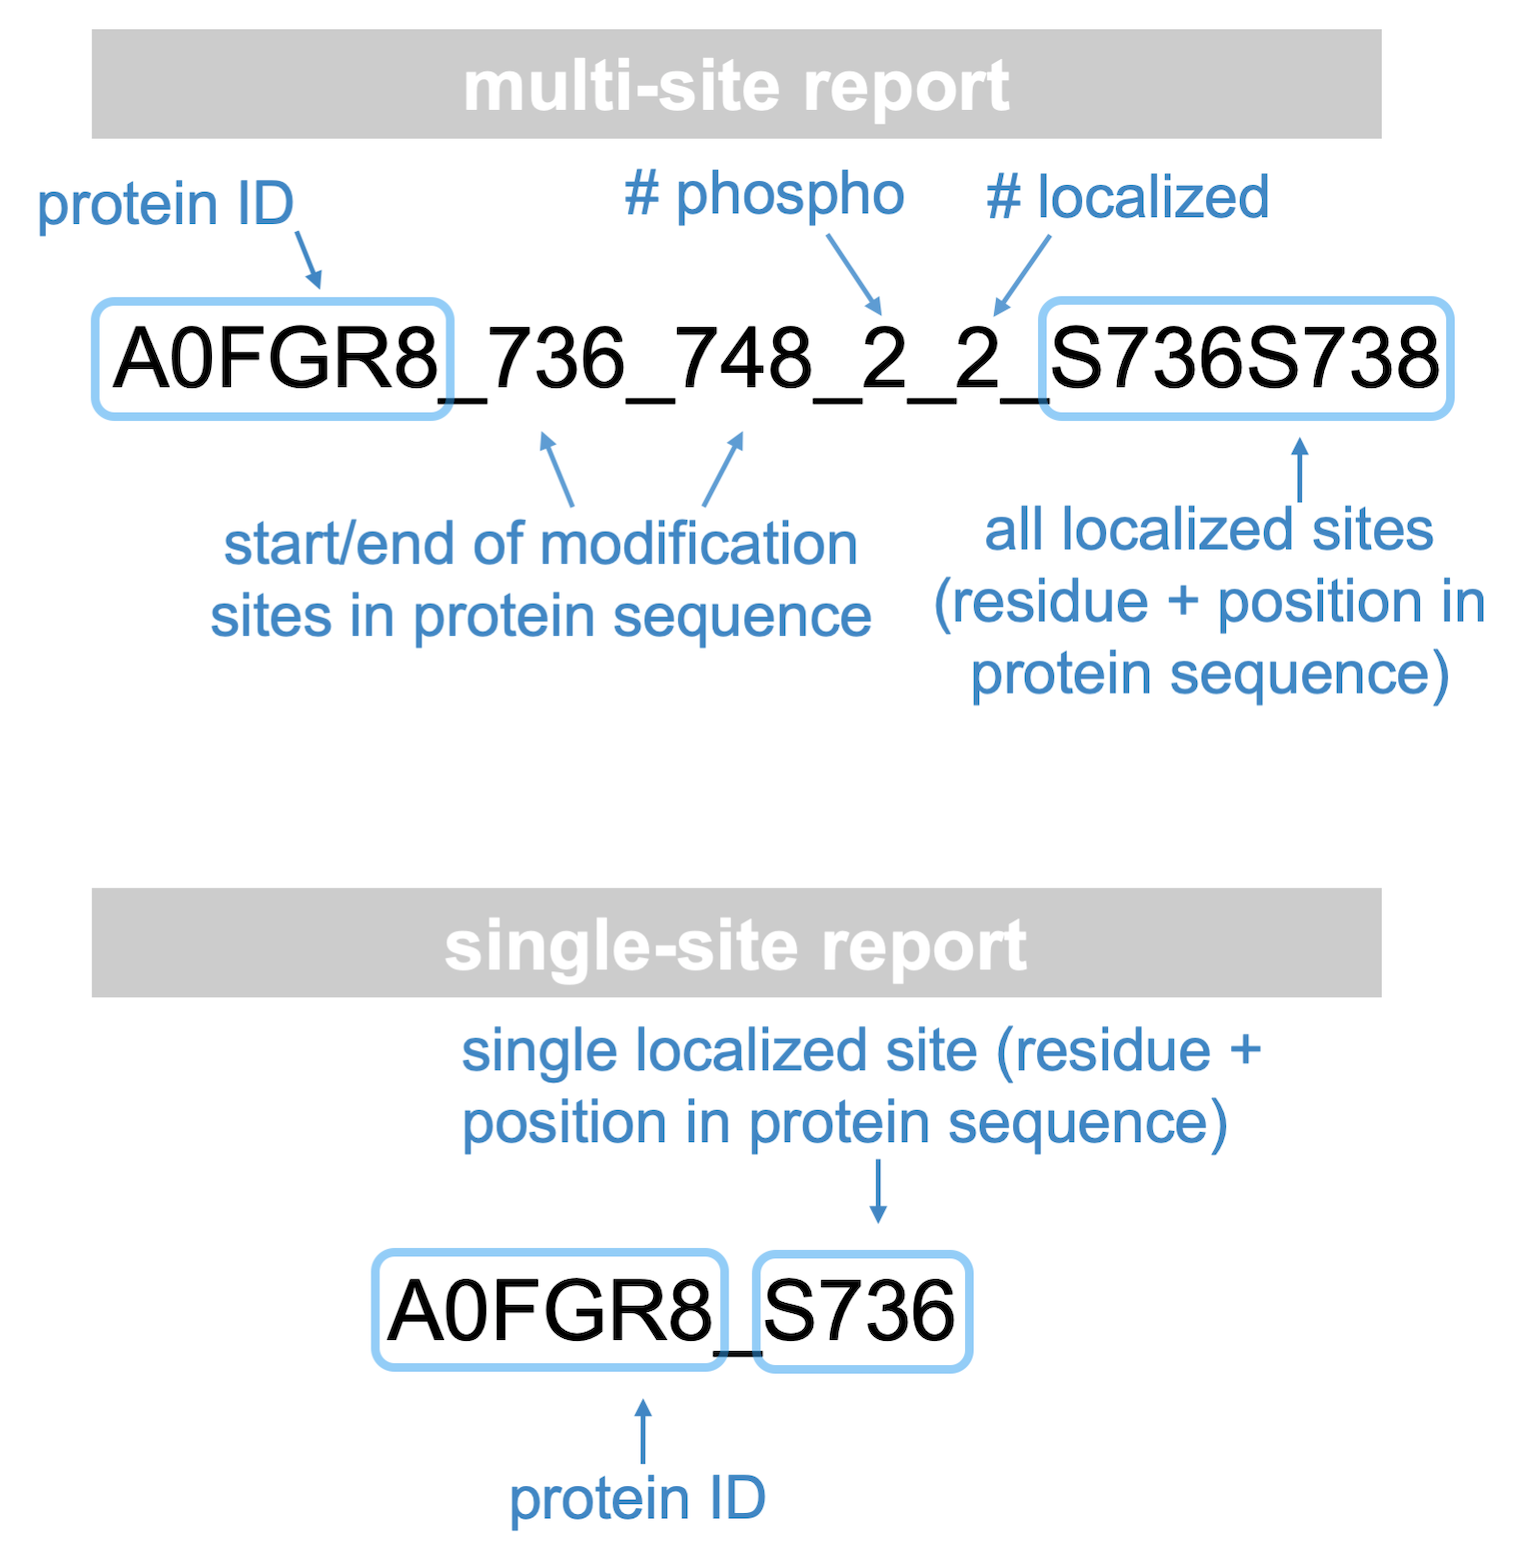
Below is an illustration of the roll-up of PTM site information from PSM to multi-site to single-site reports.